Advanced Engineering Mathematics
10th Edition
ISBN: 9780470458365
Author: Erwin Kreyszig
Publisher: Wiley, John & Sons, Incorporated
expand_more
expand_more
format_list_bulleted
Question

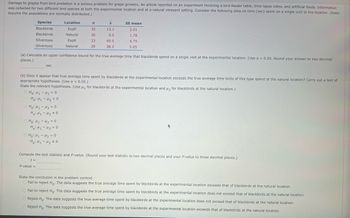
Transcribed Image Text:Damage to grapes from bird predation is a serious problem for grape growers. An article reported on an experiment involving a bird-feeder table, time-lapse video, and artificial foods. Information
was collected for two different bird species at both the experimental location and at a natural vineyard setting. Consider the following data on time (sec) spent on a single visit to the location. (Note:
Assume the populations are normally distributed.)
Species
Blackbirds
Blackbirds
Silvereyes
Silvereyes
sec
Location
Exptl
Natural
Exptl
Natural
CHỏi thì t2=0
Ha: H1 - H2 +0
Hỏi thì t2 =0
На: Н1 - H2>0
n
(a) Calculate an upper confidence bound for the true average time that blackbirds spend on a single visit at the experimental location. (Use a = 0.05. Round your answer to two decimal
places.)
о но Hi-H2=0
Hai khi thi 50
t=
P-value =
35
30
33
28
X
13.1
9.5
49.5
38.2
(b) Does it appear that true average time spent by blackbirds at the experimental location exceeds the true average time birds of this type spend at the natural location? Carry out a test of
appropriate hypotheses. (Use a = 0.05.)
SE mean
2.01
1.78
4.79
5.05
State the relevant hypotheses. (Use ₁ for blackbirds at the experimental location and ₂ for blackbirds at the natural location.)
о но нi-H2=0
на: М1 -H2 <0
Compute the test statistic and P-value. (Round your test statistic to two decimal places and your P-value to three decimal places.)
State the conclusion in the problem context.
O Fail to reject Ho. The data suggests the true average time spent by blackbirds at the experimental location exceeds that of blackbirds at the natural location.
O Fail to reject Ho. The data suggests the true average time spent by blackbirds at the experimental location does not exceed that of blackbirds at the natural location.
O Reject Ho. The data suggests the true average time spent by blackbirds at the experimental location does not exceed that of blackbirds at the natural location.
O Reject Ho. The data suggests the true average time spent by blackbirds at the experimental location exceeds that of blackbirds at the natural location.

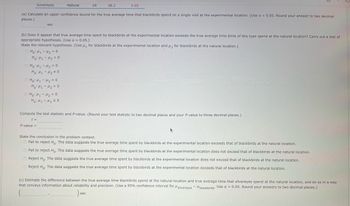
Transcribed Image Text:Silvereyes
(a) Calculate an upper confidence bound for the true average time that blackbirds spend on a single visit at the experimental location. (Use a = 0.05. Round your answer to two decimal
places.)
sec
но: H1-М2 =0
Hai thì k2 < 0
с. Но Hi-H2 = 0
Hai thì thay #0
© Hoi thi kha = 0
Нa: H1 - H2>0
о но ну-H2=0
Natural
(b) Does it appear that true average time spent by blackbirds at the experimental location exceeds the true average time birds of this type spend at the natural location? Carry out a test of
appropriate hypotheses. (Use a = 0.05.)
State the relevant hypotheses. (Use ₁ for blackbirds at the experimental location and ₂ for blackbirds at the natural location.)
H₂H₁ H₂ ≤0
28
38.2
5.05
Compute the test statistic and P-value. (Round your test statistic to two decimal places and your P-value to three decimal places.)
t =
P-value =
State the conclusion in the problem context.
O Fail to reject Ho. The data suggests the true average time spent by blackbirds at the experimental location exceeds that of blackbirds at the natural location.
O Fail to reject Ho. The data suggests the true average time spent by blackbirds at the experimental location does not exceed that of blackbirds at the natural location.
O Reject Ho. The data suggests the true average time spent by blackbirds at the experimental location does not exceed that of blackbirds at the natural location.
Reject Ho. The data suggests the true average time spent by blackbirds at the experimental location exceeds that of blackbirds at the natural location.
(c) Estimate the difference between the true average time blackbirds spend at the natural location and true average time that silvereyes spend at the natural location, and do so in a way
that conveys information about reliability and precision. (Use a 95% confidence interval for silvereyes blackbirds. Use α = 0.05. Round your answers to two decimal places.)
) sec
Expert Solution
This question has been solved!
Explore an expertly crafted, step-by-step solution for a thorough understanding of key concepts.
This is a popular solution
Trending nowThis is a popular solution!
Step by stepSolved in 4 steps with 8 images

Knowledge Booster
Similar questions
- Consider the following scenario and answer the questions below: The ornithologist decided to investigate the effect of temperature on the migration of North American birds. Develop a hypothesis in the appropriate format. Identify the independent variable. Identify the dependent variable. Plan an investigation (what would she do to collect data?). Did she engage in basic science or applied science? Explain. Did she engage in inductive or deductive reasoning? Explainarrow_forwardSuppose that as part of a research methods class, Bailey was asked to write summaries of research papers on the following topics. • The effects of increasing temperatures on the migration patterns of birds • The effects of media coverage on community support for crime prevention For each topic, identify the explanatory and the response variables. Temperature and the level of community support for crime prevention are the explanatory variables, and the amount of media coverage and the migration patterns of birds are the response variables. Temperature and the amount of media coverage are the response variables, and the migration patterns of birds and the level of community support for crime prevention are the explanatory variables. Temperature and the amount of media coverage are the explanatory variables, and the migration patterns of birds and the level of community support for crime prevention are the response variables. Temperature and the migration patterns of birds are the…arrow_forwardSuppose faN such that f is not onto but f+9 is onto Prove that 9 is onto or give a counterY example (use mapping for explain) N and :N-N are functionsarrow_forward
- 7:08 iTECH Part V ork.potsdam.edu Part VI © 4G37% 5 What graphical display is appropriate for comparing the distribution of patient death rates between hospitals that use computer systems and those that rely on the âlpaperâ system? A. A scatterplot. B. A bar chart. C. A stem-and-leaf display. D. Side-by-side boxplots. 4 Mr. Prudence read about the study results and concluded from there that hospitals should adopt computerized automation of notes and records because it increases patientsâ chance of survival. Which of the following is a correct statement about Mr. Prudenceâs conclusion? A. It is a valid conclusion because the study was based on a very large number of patients. B. It is a valid conclusion because the study results showed that hospitals which use computerized systems have a lower patient death rate. C. It is an invalid conclusion because this study does not necessarily prove a causal relationship between the use of ||| computerized system and hospital mortality. D. Both A)…arrow_forwardA snow shovel manufacturer is considering a new shovel with small holes punched in it, thought to reduce energy expenditure of the user. The data in the Problem 4 tab provides information for 13 workers using both the conventional shovel and the perforated shovel. Does the data suggest that the energy expenditure of the perforated shovel is lower than that of the conventional shovel? Does the data suggest that the variance of the two shovels is different?arrow_forwardThese two questions please.arrow_forward
- Please be advised these are practice exam questions.arrow_forwardThere is a strong relationship between heterosexual couples attractiveness scores. Therefore, a researcher wanted to determine if husbands attractiveness score may be predicted from their counterparts’ scores. Below are couples attractiveness ratings. Observation Wife (X) Husband (Y) 1 11 14 2 6 7 3 16 15 4 4 7 5 1 3 6 10 9 7 5 9 8 3 8 Complete the following ANOVA table Source SS DF MS F SSreg SSres SStotalarrow_forwardA science project involves testing the effects of different types of music on plant growth. A sample of 24 newly sprouted bean plants is obtained. The plants are randomly assigned to each experimental condition (6 per group). The experimental conditions are: rock music, heavy metal, country, and classical. The dependent variable is the height of each plant after 2 weeks. The ANOVA results are summarized as follows: MSB = 10 and SSW =40. Construct a summary table for this studyarrow_forward
arrow_back_ios
arrow_forward_ios
Recommended textbooks for you
 Advanced Engineering MathematicsAdvanced MathISBN:9780470458365Author:Erwin KreyszigPublisher:Wiley, John & Sons, Incorporated
 Numerical Methods for EngineersAdvanced MathISBN:9780073397924Author:Steven C. Chapra Dr., Raymond P. CanalePublisher:McGraw-Hill Education
 Introductory Mathematics for Engineering Applicat...Advanced MathISBN:9781118141809Author:Nathan KlingbeilPublisher:WILEY
 Mathematics For Machine TechnologyAdvanced MathISBN:9781337798310Author:Peterson, John.Publisher:Cengage Learning,


Advanced Engineering Mathematics
Advanced Math
ISBN:9780470458365
Author:Erwin Kreyszig
Publisher:Wiley, John & Sons, Incorporated

Numerical Methods for Engineers
Advanced Math
ISBN:9780073397924
Author:Steven C. Chapra Dr., Raymond P. Canale
Publisher:McGraw-Hill Education

Introductory Mathematics for Engineering Applicat...
Advanced Math
ISBN:9781118141809
Author:Nathan Klingbeil
Publisher:WILEY

Mathematics For Machine Technology
Advanced Math
ISBN:9781337798310
Author:Peterson, John.
Publisher:Cengage Learning,

