DA1 Problem 3: Construct a 95% confidence
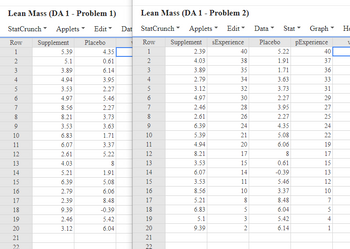
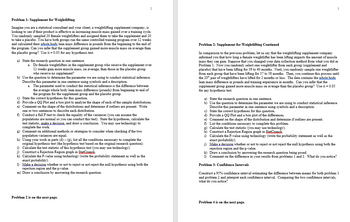
This problem is one of four problems in the data analysis assignment. It cannot be answered without the answers to Problems one and two. I am not able to upload a CSV/Excel file, it doesn't allow me to do so. I have included screenshots of the Data Needed to solve Problems one and two, which are needed to solve Problem three. I also included a screenshot of problems one and two to make sure you're able to answer those as well. I only want assistance with Problem 3.
Please don't reject my request, I have given all the data necessary to help with answering the question.


Trending nowThis is a popular solution!
Step by stepSolved in 6 steps with 8 images

- Your team members were interested in (a) how students were connecting with their professors and lecture content, (b) how in control students felt over their learning, and (c) how much they valued what they were learning during online lectures given the switch from in-person to virtual learning at the start of the pandemic. They collected data by briefly interrupting students at three-time points throughout an online lecture (similar to Dataset 1) to answer three different questions. They were asked “did you generate a personal connection with the information you were learning?” on a scale of 1 (not at all) to 9 (extremely), “I have the impression that my learning the content from this lecture so far has been under my control” on a scale from 1 (strongly disagree) to 5 (strongly agree), and “I believe that the content I learned from this lecture so far has been valuable for me to learn” on a scale from 1 (strongly disagree) to 5 (strongly agree). Each answer that participants provided…arrow_forwardUsing the latest in medical technology, an orthopedic doctor has developed a new surgical procedure that he believes is an improvement over the standard procedure. He wants to study whether the mean recovery time of patients who have the new procedure is less than the mean recovery time of patients who have the standard procedure. The doctor studies a random sample of 11 patients who have the new procedure and a random sample of 9 patients who have the standard procedure. (These samples are chosen independently.) The doctor records each patient's recovery time (in days). The patients who had the new procedure have a sample mean recovery time of 367.3 with a sample variance of 2851.8. The patients who had the standard procedure have a sample mean recovery time of 420.9 with a sample variance of 98.1. Assume that the two populations of recovery times are approximately normally distributed. Can the doctor conclude, at the 0.01 level of significance, that the population mean of the…arrow_forwardHelp me pleasearrow_forward
- Identifying individuals with a high risk of Alzheimer's disease usually involves a long series of cognitive tests. However, researchers have developed a 7-Minute Screen, which is a quick and easy way to accomplish the same goal. The question is whether the 7-Minute Screen is as effective as the complete series of tests. To address this question, Ijuin et al. (2008) administered both tests to a group of patients and compared the results. The following data represent results similar to those obtained in the study. 7-Minute Screen Cognitive Series 3 11 8 19 10 22 8 20 4 14 7 13 4 9 5 20 14 25 Which statistical test would you select: Answer H0: Answer H1: Answer What is the coefficient that indicates the strength of the relationship? Answer =Answer What is the standard error? Answer What is the appropriate 95% CI? [ Answer , Answer ] What is the d-effect size? Answer What is the t-observed? Answer What is the actual p-value? Answer THREE decimal places…arrow_forwardIdentifying individuals with a high risk of Alzheimer’s disease usually involves a long series of cognitive tests. However, researchers have developed a 7-Minute Screen, which is a quick and easy way to accomplish the same goal. The question is whether the 7-Minute Screen is as effective as the complete series of tests. To address this question, Ijuin et al. (2008) administered both tests to a group of patients and compared the results. The following data represent results similar to those obtained in the study. Patient 7-Minute Screen Cognitive Series A 3 7 B 7 15 C 4 14 D 5 13 E 7 9 F 5 15 G 11 25 The alternative hypothesis in words and null hypothesis in symbols for a two-tailed test isarrow_forwardA police academy has just brought in a batch of new recruits. All recruits are given an aptitude test and a fitness test. Suppose a researcher wants to know if there is a significant difference in aptitude scores based on a recruits’ fitness level. Recruits are ranked on a scale of 1 – 3 for fitness (1 = lowest fitness category, 3 = highest fitness category). Using “ApScore” as your dependent variable and “FitGroup” as your independent variable, conduct a One-Way, Between Subjects, ANOVA, at α = 0.05, to see if there is a significant difference on the aptitude test between fitness groups. Identify the correct symbolic notation for the alternative hypothesis. A. H0: µ1 = µ2 B. HA: µ1 ≠ µ2 ≠ µ3 C. H0: µ1 = µ2 = µ3 D. HA: µ1 ≠ µ2arrow_forward
- When two independent variables produce effects when combined that would not be present if each independent variables was manipulated in a separate study, we say that there is O no main effect. O only a measured variable an interaction. O a planned comparison. rist and Stangor (2001) studied prejudice and found that you can't predict a person's behavior toward minorities on the basis of whether they are high or lowarrow_forwardHelp please! (b) Despite the results being statistically significant, the authors stated in their article about the first study: "The field study did not support an examination of why more creative store windows led consumers to enter the stores. … The use of actual retailers' real store windows meant that the level of creativity was not the only variable that differed among the retailers and their windows." How does the second study address some of those drawbacks? Does either study suffer from a lack of realism? Choose the best explanation. A) The drawbacks in the first study were that it was an observational study and that it did not control for confounding variables (such as variations in merchandise and potential customers). The second study addresses these drawbacks by using the same retailer and the same merchandise, and by only changing the creativity of the window display. Neither study suffers from a lack of realism, since statistically significant results were…arrow_forwardScenario: If 20 participants completed an attention task twice — once after consuming a sugar pill and once after consuming a pill that contained 25 mg nicotine, which test would be most appropriate? Assume data meets all assumptions for a parametric test, and that participant exposure to the sugar pill vs. nicotine pill were counterbalanced. Question: Which of the following best describes the research design? Descriptive Predictive Quasi-experimental Experimentalarrow_forward
- The same media consultants decided to continue their investigation of the focal relationship between income and TV viewing habits. In order to confirm the existence of the focal relationship, they decided to control for immigration status by adding a variable measuring the number of each survey respondent's grandparents who were born outside the U.S. The researchers wonder if immigration background could influence both income and TV watching (but they hope this is not true, because it could invalidate the focal relationship). The researchers conduct a multivariate regression by adding a measure of number of grandparents born outside the U.S. to the regression equation presented in Equation 2 of Table 1. The results of the second regression equation are presented in Equation 2 of Table 1. Table 1. OLS Regression Coefficients Representing Influence of Income and Control Variables on Number of Hours of TV Watched per Day Equation 1 Equation 2 Equation 3 Annual Income…arrow_forwardIdentifying individuals with a high risk of Alzheimer’s disease usually involves a long series of cognitive tests. However, researchers have developed a 7-Minute Screen, which is a quick and easy way to accomplish the same goal. The question is whether the 7-Minute Screen is as effective as the complete series of tests. To address this question, Ijuin et al. (2008) administered both tests to a group of patients and compared the results. The following data represent results similar to those obtained in the study: Patient 7-Minute Screen Cognitive Tests A 3 11 B 8 19 C 10 22 D 8 20 E 4 14 F 7 13 G 4…arrow_forward
 MATLAB: An Introduction with ApplicationsStatisticsISBN:9781119256830Author:Amos GilatPublisher:John Wiley & Sons Inc
 Probability and Statistics for Engineering and th...StatisticsISBN:9781305251809Author:Jay L. DevorePublisher:Cengage Learning
 Statistics for The Behavioral Sciences (MindTap C...StatisticsISBN:9781305504912Author:Frederick J Gravetter, Larry B. WallnauPublisher:Cengage Learning
 Elementary Statistics: Picturing the World (7th E...StatisticsISBN:9780134683416Author:Ron Larson, Betsy FarberPublisher:PEARSON
 The Basic Practice of StatisticsStatisticsISBN:9781319042578Author:David S. Moore, William I. Notz, Michael A. FlignerPublisher:W. H. Freeman
 Introduction to the Practice of StatisticsStatisticsISBN:9781319013387Author:David S. Moore, George P. McCabe, Bruce A. CraigPublisher:W. H. Freeman


