
MATLAB: An Introduction with Applications
6th Edition
ISBN: 9781119256830
Author: Amos Gilat
Publisher: John Wiley & Sons Inc
expand_more
expand_more
format_list_bulleted
Related questions
Question
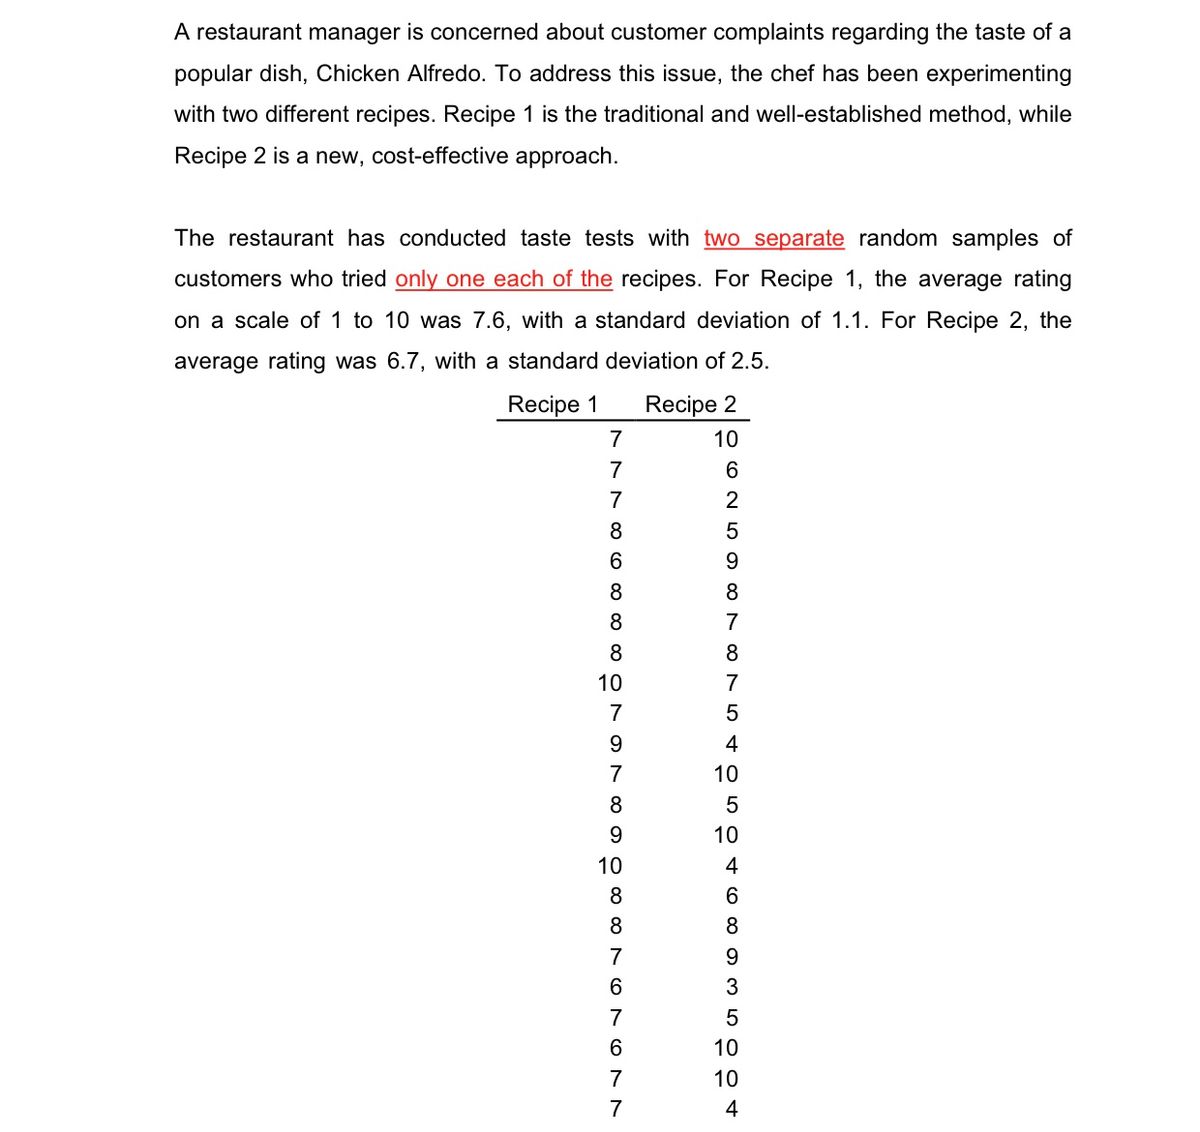

Transcribed Image Text:A restaurant manager is concerned about customer complaints regarding the taste of a
popular dish, Chicken Alfredo. To address this issue, the chef has been experimenting
with two different recipes. Recipe 1 is the traditional and well-established method, while
Recipe 2 is a new, cost-effective approach.
The restaurant has conducted taste tests with two separate random samples of
customers who tried only one each of the recipes. For Recipe 1, the average rating
on a scale of 1 to 10 was 7.6, with a standard deviation of 1.1. For Recipe 2, the
average rating was 6.7, with a standard deviation of 2.5.
Recipe 1
81780 000 ∞ ∞ O
6
8
8
8
10
7
9
S785∞∞ONONN
9
10
6
6
Recipe 2
10
C 700 OSO OO4
6
2
5
9
8
8
7
5
4
10
5
10
4
6
8
9
3
5
10
10

Transcribed Image Text:The manager is concerned that Recipe 2 may not be as well-received as Recipe 1, and
they want to determine if there is a statistically significant difference in customer
satisfaction between the two recipes. They need to make an informed decision about
whether to continue offering Recipe 2 or stick with the traditional Recipe 1
Using this data set perform the following tasks. Do all calculations 'manually' (i.e., with
a hand calculator without using R, Excel, or any other software), showing the relevant
formulas and the major steps. Use the sample means and standard deviations
provided.
(a)
Is there statistical evidence that the population variances for both samples are the
same? What parametric test can you use to answer this question? Answer using
the six steps of hypothesis testing; including by stating the null and alternative
hypotheses; providing an appropriate test statistic and its distribution and
describing an appropriate decision rule. Implement this test using a 5%
significance level.
(b)
(c)
Test if the population mean 'time to failure' of Method 2 is quicker (less) than that
of Method 1. Answer using the six steps of hypothesis testing; including by stating
the null and alternative hypotheses; providing an appropriate test statistic and its
distribution and describing an appropriate decision rule. Implement this test using a
5% significance level.
What are the requirements of the hypothesis tests you performed in parts (a) and
(b)? Are the requirements about the experimental design, the variable of interest
and the measurement scale met? Explain your answers.
Expert Solution
This question has been solved!
Explore an expertly crafted, step-by-step solution for a thorough understanding of key concepts.

This is a popular solution

Trending nowThis is a popular solution!

Step by stepSolved in 4 steps with 9 images

Knowledge Booster

Similar questions
- Problem: An administer claims that the proportion of students who pass a particular test given to all college freshmen is 77.32%. To test the claim an SRS of size 199 test scores was collected. The sample had 74 students pass the test. Find the test statistic.arrow_forwardA local fast-food restaurant serves buffalo wings. The restaurant’s managers notice that they normally sell the following proportions of flavors for their wings: 20% Spicy Garlic, 10% Classic Medium, 20% Teriyaki, 30% Hot BBQ, and 20% Asian Zing. After running a campaign to promote their nontraditional specialty wings, they want to know if the campaign has made an impact. The results after 10 days are listed in the following table. Is there sufficient evidence at the 0.05 level of significance to say that the promotional campaign has made any difference in the proportions of flavors sold? Buffalo Wing Sales Number Sold Spicy Garlic 101 Classic Medium 73 Teriyaki 119 Hot BBQ 145 Asian Zing 121 Copy Data Step 3 of 4 : Compute the value of the test statistic. Round any intermediate calculations to at least six decimal places, and round your final answer to three decimal places.arrow_forwardA local fast-food restaurant serves buffalo wings. The restaurant's managers notice that they normally sell the following proportions of flavors for their wings: 10 % Spicy Garlic, 20 % Classic Medium, 30 % Teriyaki, 20 % Hot BBQ, and 20 % Asian Zing. After running a campaign to promote their nontraditional specialty wings, they want to know if the campaign has made an impact. The results after 10 days are listed in the following table. Is there sufficient evidence at the 0.05 level of significance to say that the promotional campaign has made any difference in the proportions of flavors sold? Buffalo Wing Sales Number Sold Spicy Garlic 74 Classic Medium 121 Teriyaki 139 Hot BBQ 116 Asian Zing 108 Copy Data Step 2 of 4: Calculate the expected value for the number of spicy garlic wings sold. Round your answer to three decimal places, if necessary.arrow_forward
- The Difference of Two Sample Proportions: III Belinda plans to take a simple random sample of 2500 U.S. adults and to compute the proportion of them who believe in the theory of evolution. (Call this sample proportion p1-hat.) She also intends to take an independent simple random sample of 1600 adults from France and to compute the the proportion of them who believe in the theory of evolution. (Call this sample proportion p2-hat.) Unknown to Belinda, the proportion of all U.S. adults who believe in the theory of evolution is 0.50 (or 50%), whereas the proportion of all French adults who believe in the theory of evolution is 0.75, or 75%. Using the expected value and the SD of p1-hat minus p2-hat, which of the following makes the most sense? Group of answer choices ( ) The percentage of adults in the U.S. sample who believe in evolution should turn out to be about 25% less than the percentage of adults in the French sample who believe in evolution, give or take about 3% or so for…arrow_forwardIn your biology class, your final grade is based on several things: a lab score, scores on two major tests, and your score on the final exam. There are 100 points available for each score. However, the lab score is worth 19% of your total grade, each major test is worth 21.5%, and the final exam is worth 38%. Compute the weighted average for the following scores: 95 on the lab, 82 on the first major test, 64 on the second major test, and 86 on the final exam.arrow_forwardA study found that the ratio between the number of people who drive cars and the number of people who ride bicycles is 1:3. Additionally, of those who drive cars, one out of five drive electric cars, Out of all people who drive cars and ride bicycles, which of the following represents the percentage of people who use non-electric gasoline cars? Select the single best answer: A. 10% B. 13% C. 20% D. 25% E. This cannot be determined.arrow_forward
- The brand manager for a brand of toothpaste must plan a campaign to increase brand recognition. He wants to first determine the percentage of adults who have heard of the brand. How many adults must he survey in order to be 98% confident that his estimate is within five percentage points of the true population percentage? (Assume that nothing is known about the percentage of adults who have heard of the brand.)arrow_forwardAnita's, a fast-food chain specializing in hot dogs and garlic fries, keeps track of the proportion of its customers who decide to eat in the restaurant (as opposed to ordering the food "to go"), so it can make decisions regarding the possible construction of in-store play areas, the attendance of its mascot Sammy at the franchise locations, and so on. Anita's reports that 45% of its customers order their food to go. If this proportion is correct, what is the probability that, in a random sample of 5 customers at Anita's, exactly 3 order their food to go?arrow_forwardThe American Heart Association is about to conduct an anti-smoking campaign and wants to know the fraction of Americans over 38 who smoke. Step 1 of 2: Suppose a sample of 273 Americans over 38 is drawn. Of these people, 79 smoke. Using the data, estimate the proportion of Americans over 38 who smoke. Enter your answer as a fraction or a decimal number rounded to three decimal places. Step 2 of 2: Suppose a sample of 273 Americans over 38 is drawn. Of these people, 79 smoke. Using the data, construct the 85% confidence interval for the population proportion of Americans over 38 who smoke. Round your answers to three decimal places. Lower end point, upper end pointarrow_forward
- A nutritionist estimates that 57% of her patients stick to the eating plan she helps them design. She also knows that 53% of her patients are diabetic. Additionally she knows that 22.79% of her patients are diabetic and are not sticking to the eating plan she helped them design. (a) What proportion of her patients are not sticking to the eating plan she helped them design? (b) What proportion of her patients are diabetic? (c) Within the nutritionist's patients, being diabetic and not sticking to the eating plan she helped design are which of the following? O dependent O independentarrow_forwardCory is serving coffee in a large reception with many guests. There are two kinds of coffee: regular anddecaf. So far, he has served 71 cups of regular and 49 cups of decaf.Question 3.Based on the information so far:(a) Estimate the proportion of coffee-drinking guests who prefer regular.arrow_forward
arrow_back_ios
arrow_forward_ios
Recommended textbooks for you
- MATLAB: An Introduction with ApplicationsStatisticsISBN:9781119256830Author:Amos GilatPublisher:John Wiley & Sons Inc
 Probability and Statistics for Engineering and th...StatisticsISBN:9781305251809Author:Jay L. DevorePublisher:Cengage Learning
 Statistics for The Behavioral Sciences (MindTap C...StatisticsISBN:9781305504912Author:Frederick J Gravetter, Larry B. WallnauPublisher:Cengage Learning
  Elementary Statistics: Picturing the World (7th E...StatisticsISBN:9780134683416Author:Ron Larson, Betsy FarberPublisher:PEARSON
 The Basic Practice of StatisticsStatisticsISBN:9781319042578Author:David S. Moore, William I. Notz, Michael A. FlignerPublisher:W. H. Freeman
 Introduction to the Practice of StatisticsStatisticsISBN:9781319013387Author:David S. Moore, George P. McCabe, Bruce A. CraigPublisher:W. H. Freeman
MATLAB: An Introduction with Applications
Statistics
ISBN:9781119256830
Author:Amos Gilat
Publisher:John Wiley & Sons Inc
Probability and Statistics for Engineering and th...
Statistics
ISBN:9781305251809
Author:Jay L. Devore
Publisher:Cengage Learning
Statistics for The Behavioral Sciences (MindTap C...
Statistics
ISBN:9781305504912
Author:Frederick J Gravetter, Larry B. Wallnau
Publisher:Cengage Learning
Elementary Statistics: Picturing the World (7th E...
Statistics
ISBN:9780134683416
Author:Ron Larson, Betsy Farber
Publisher:PEARSON
The Basic Practice of Statistics
Statistics
ISBN:9781319042578
Author:David S. Moore, William I. Notz, Michael A. Fligner
Publisher:W. H. Freeman
Introduction to the Practice of Statistics
Statistics
ISBN:9781319013387
Author:David S. Moore, George P. McCabe, Bruce A. Craig
Publisher:W. H. Freeman