MATLAB: An Introduction with Applications
6th Edition
ISBN: 9781119256830
Author: Amos Gilat
Publisher: John Wiley & Sons Inc
expand_more
expand_more
format_list_bulleted
Concept explainers
Topic Video
Question
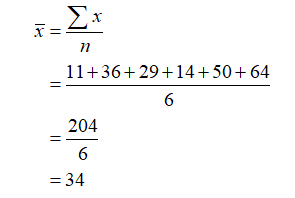
Find the sample variance and the sample standard deviation for the given data: Christine got the following scores on her most recent six college astronomy quizzes. 11 36 29 14 50 64
Expert Solution
arrow_forward
Step 1
| x(scores) | 11 | 36 | 29 | 14 | 50 | 64 |
The mean of the data can be calculated as:

Trending nowThis is a popular solution!
Step by stepSolved in 2 steps with 2 images

Knowledge Booster
Learn more about
Need a deep-dive on the concept behind this application? Look no further. Learn more about this topic, statistics and related others by exploring similar questions and additional content below.Similar questions
- Consider the following data set. Round your answers to the nearest hundredth as needed. 101 88 71 101 101 67 83 87 76 91 Mean = Median = Mode = Range Sample Standard Deviation =arrow_forwardWhich data set would give the smallest standard deviation? Select one: a. {100, 150, 200, 250, 300} O b. {1, 5, 7, 150, 2} O c. {4, 20, 55, 100, 2} O d. (56, 20, 34, 102, 30}arrow_forwardFind the sample variance of the following set of data: 10, 5, 8, 8, 9. Round the final answer to one decimal place.( show calculation)arrow_forward
- Which of the following percentiles represents the median of a data set? Select one: a. 100th b. 25th c. 50th d. 75tharrow_forwardTwenty-five randomly selected students were asked the number of movies they watched the previous week. The results are as follows: # of movies Frequency0 51 92 63 44 1Table 2.83 a. Find the sample mean x¯.b. Find the approximate sample standard deviation, sarrow_forwardFind the percentile of the sample data 20 and 37.arrow_forward
- Calculate the range, variance and standard deviation for the following sample data. Scores: 10, 7, 9, 1, 2, 0, 6arrow_forwardFind the median and lower quartile of the number of wins of the Mariners for 6 years. Years and wins below: 2010/2011/2012/2013/2014/2015 71 61 72 86 89 95 A) Find the median. Show work. B) Find the lower quartile. Show work.arrow_forwardFind the variance for the following data 72,62,52,45 Round to three decimal placesarrow_forward
- A sales manager recorded the number of sales made by each of the 300 salespeople working athis chain of furniture outlet stores on a Saturday and created the following table.# Sales (bins) Proportion of salespeople in this bin0 – 3 0.053 – 6 0.156 – 9 0.30 9 – 12 0.3512 -15 0.15a. What is the unit of observation in this sample?b. What is the variable collected?c. Draw and label the histogram for this dataset.d. Which is the modal category?e. Calculate the proportion of the salespeople made 9 or more sales.f. Calculate the number of salespeople who made between 0 and 9 sales.arrow_forwardAn instructor wanted to know if his students are better at math or writing. He had students take both a math and then a writing test and he compared the results using SPSS. He found the following results: ( look at graphs ) a. What test was done?b. Report results in APA style.arrow_forwardMarc takes a random sample of 14 dogs from the local animal shelter and weighs them. He obtains the following data: 9 25 32 40 41 45 47 50 53 53 62 79 94 106 What is the median for this data?arrow_forward
arrow_back_ios
SEE MORE QUESTIONS
arrow_forward_ios
Recommended textbooks for you
 MATLAB: An Introduction with ApplicationsStatisticsISBN:9781119256830Author:Amos GilatPublisher:John Wiley & Sons Inc
 Probability and Statistics for Engineering and th...StatisticsISBN:9781305251809Author:Jay L. DevorePublisher:Cengage Learning
 Statistics for The Behavioral Sciences (MindTap C...StatisticsISBN:9781305504912Author:Frederick J Gravetter, Larry B. WallnauPublisher:Cengage Learning
 Elementary Statistics: Picturing the World (7th E...StatisticsISBN:9780134683416Author:Ron Larson, Betsy FarberPublisher:PEARSON
 The Basic Practice of StatisticsStatisticsISBN:9781319042578Author:David S. Moore, William I. Notz, Michael A. FlignerPublisher:W. H. Freeman
 Introduction to the Practice of StatisticsStatisticsISBN:9781319013387Author:David S. Moore, George P. McCabe, Bruce A. CraigPublisher:W. H. Freeman

MATLAB: An Introduction with Applications
Statistics
ISBN:9781119256830
Author:Amos Gilat
Publisher:John Wiley & Sons Inc

Probability and Statistics for Engineering and th...
Statistics
ISBN:9781305251809
Author:Jay L. Devore
Publisher:Cengage Learning

Statistics for The Behavioral Sciences (MindTap C...
Statistics
ISBN:9781305504912
Author:Frederick J Gravetter, Larry B. Wallnau
Publisher:Cengage Learning

Elementary Statistics: Picturing the World (7th E...
Statistics
ISBN:9780134683416
Author:Ron Larson, Betsy Farber
Publisher:PEARSON

The Basic Practice of Statistics
Statistics
ISBN:9781319042578
Author:David S. Moore, William I. Notz, Michael A. Fligner
Publisher:W. H. Freeman

Introduction to the Practice of Statistics
Statistics
ISBN:9781319013387
Author:David S. Moore, George P. McCabe, Bruce A. Craig
Publisher:W. H. Freeman