
ENGR.ECONOMIC ANALYSIS
14th Edition
ISBN: 9780190931919
Author: NEWNAN
Publisher: Oxford University Press
expand_more
expand_more
format_list_bulleted
Related questions
Question
thumb_up100%
Please see below. Both pictures are part of the same question. The first picture contains the graph needed and the second one contains the questions being asked.
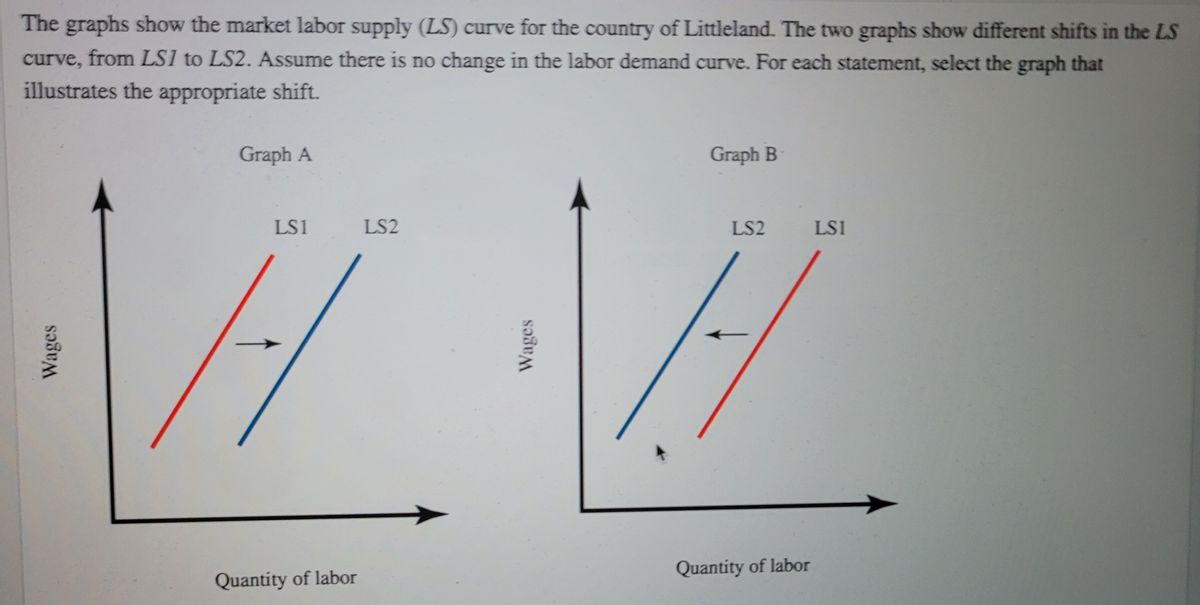

Transcribed Image Text:The graphs show the market labor supply (LS) curve for the country of Littleland. The two graphs show different shifts in the LS
curve, from LS1 to LS2. Assume there is no change in the labor demand curve. For each statement, select the graph that
illustrates the appropriate shift.
Graph A
Graph B
LS1
LS2
LS2
LS1
Quantity of labor
Quantity of labor
Wages

Transcribed Image Text:a. The equilibrium wage rate increases.
b. The equilibrium wage rate decreases.
Graph A
O Graph B
O Graph A
O Graph B
c. The government introduces a free childcare policy.
d. Immigration to Littleland increases.
с.
O Graph A
O Graph B
Graph A
O Graph B
f. The birthrate in Littleland decreases.
e. Emigration from Littleland increases.
O Graph A
O Graph B
O Graph A
O Graph B
g. The birthrate in Littleland increases.
Graph B.
Graph A
ing
0036
Expert Solution
This question has been solved!
Explore an expertly crafted, step-by-step solution for a thorough understanding of key concepts.

This is a popular solution

Trending nowThis is a popular solution!

Step by stepSolved in 2 steps

Knowledge Booster


Learn more about
Need a deep-dive on the concept behind this application? Look no further. Learn more about this topic, economics and related others by exploring similar questions and additional content below.Similar questions
- e Price -Q₁ Quantity Which of the following scenarios is BEST represented in the graph? A number of sellers increase B decrease in government taxes C resource costs increase D technology improvesarrow_forwardConsider the scenario. Explain using written and graphical analysis What will happen in the market for tomatoes if a new study is released that showsthat pesticides used on tomatoes contain cancer forming agents.arrow_forwardhelp please answer in text form with proper workings and explanation for each and every part and steps with concept and introduction no AI no copy paste remember answer must be in proper format with all workingarrow_forward
- A Moving to another question will save this response. Question 4 Refer to the information provided in Table 22.5 below to answer the question(s) that follow. Table 22.5 Price per Unit in 2014 2015 $2.00 Units Purchased 2013 $2.00 $2.00 $2.50 2016 $2.10 $2.40 $2.50 $3.50 $4.00 Blueberries 8 Pineapples $2.50 $3.00 Cheese 3 $3.00 Refer to Table 22.5. If 2014 is the base year, the consumer price index in 2013 is 0.893. 0.96. 1.04. 1.119.arrow_forwardMICROECONOMICS Questions 3 ( ALL OF IT IS ONE QUESTION!!!) For article 3 write the number of the graph that best describes what happened. Fill in only the appropriate boxes in the chart for article 3 and be sure and indicate if it is an increase or a decrease. For the graph use an arrow to indicate an increase or a decrease. Make sure you fill in the graph PLEASE Leave it blank if there is no change Masks (Now). The easing Covid-19 pandemic is expected to reduce demand for medical masks this year, joining a group of companies that have forecast a decline in business from Covid-19 prevention. Masks became a billion-dollar business for the St. Paul, Minn., manufacturer starting in 2020, when the virus’s rapid spread sent consumers and healthcare workers looking to secure facial coverings to try to avoid infection. Now, as the latest U.S. surge caused by the Omicron variant fades, 3M said they are seeing slowing mask sales. WHICH GRAPH BEST FITS THE ARTICLE. Graph # Graph…arrow_forwardQuestion 9: _____ refers to the satisfaction gained through consumption while _____ refers to the amount of worth a consumer attributes to a good or service. A Scale, wants B Influence, costs C Utility, Valuearrow_forward
arrow_back_ios
arrow_forward_ios
Recommended textbooks for you
 Principles of Economics (12th Edition)EconomicsISBN:9780134078779Author:Karl E. Case, Ray C. Fair, Sharon E. OsterPublisher:PEARSON
 Engineering Economy (17th Edition)EconomicsISBN:9780134870069Author:William G. Sullivan, Elin M. Wicks, C. Patrick KoellingPublisher:PEARSON
 Principles of Economics (MindTap Course List)EconomicsISBN:9781305585126Author:N. Gregory MankiwPublisher:Cengage Learning
 Managerial Economics: A Problem Solving ApproachEconomicsISBN:9781337106665Author:Luke M. Froeb, Brian T. McCann, Michael R. Ward, Mike ShorPublisher:Cengage Learning
 Managerial Economics & Business Strategy (Mcgraw-...EconomicsISBN:9781259290619Author:Michael Baye, Jeff PrincePublisher:McGraw-Hill Education
Principles of Economics (12th Edition)
Economics
ISBN:9780134078779
Author:Karl E. Case, Ray C. Fair, Sharon E. Oster
Publisher:PEARSON
Engineering Economy (17th Edition)
Economics
ISBN:9780134870069
Author:William G. Sullivan, Elin M. Wicks, C. Patrick Koelling
Publisher:PEARSON
Principles of Economics (MindTap Course List)
Economics
ISBN:9781305585126
Author:N. Gregory Mankiw
Publisher:Cengage Learning
Managerial Economics: A Problem Solving Approach
Economics
ISBN:9781337106665
Author:Luke M. Froeb, Brian T. McCann, Michael R. Ward, Mike Shor
Publisher:Cengage Learning
Managerial Economics & Business Strategy (Mcgraw-...
Economics
ISBN:9781259290619
Author:Michael Baye, Jeff Prince
Publisher:McGraw-Hill Education