ENGR.ECONOMIC ANALYSIS
14th Edition
ISBN: 9780190931919
Author: NEWNAN
Publisher: Oxford University Press
expand_more
expand_more
format_list_bulleted
Question
include graphs/diagrams accordingly

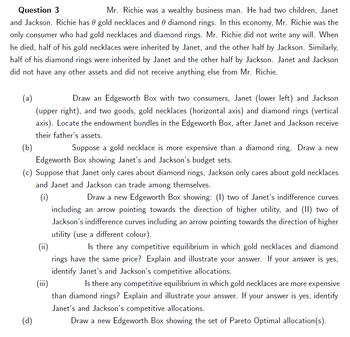
Transcribed Image Text:Question 3
Mr. Richie was a wealthy business man. He had two children, Janet
and Jackson. Richie has gold necklaces and diamond rings. In this economy, Mr. Richie was the
only consumer who had gold necklaces and diamond rings. Mr. Richie did not write any will. When
he died, half of his gold necklaces were inherited by Janet, and the other half by Jackson. Similarly,
half of his diamond rings were inherited by Janet and the other half by Jackson. Janet and Jackson
did not have any other assets and did not receive anything else from Mr. Richie.
(a)
Draw an Edgeworth Box with two consumers, Janet (lower left) and Jackson
(upper right), and two goods, gold necklaces (horizontal axis) and diamond rings (vertical
axis). Locate the endowment bundles in the Edgeworth Box, after Janet and Jackson receive
their father's assets.
(b)
Suppose a gold necklace is more expensive than a diamond ring. Draw a new
Edgeworth Box showing Janet's and Jackson's budget sets.
(c) Suppose that Janet only cares about diamond rings, Jackson only cares about gold necklaces
and Janet and Jackson can trade among themselves.
(i)
Draw a new Edgeworth Box showing: (1) two of Janet's indifference curves
including an arrow pointing towards the direction of higher utility, and (II) two of
Jackson's indifference curves including an arrow pointing towards the direction of higher
utility (use a different colour).
(d)
(ii)
Is there any competitive equilibrium in which gold necklaces and diamond
rings have the same price? Explain and illustrate your answer. If your answer is yes,
identify Janet's and Jackson's competitive allocations.
(iii)
Is there any competitive equilibrium in which gold necklaces are more expensive
than diamond rings? Explain and illustrate your answer. If your answer is yes, identify
Janet's and Jackson's competitive allocations.
Draw a new Edgeworth Box showing the set of Pareto Optimal allocation(s).
Expert Solution
This question has been solved!
Explore an expertly crafted, step-by-step solution for a thorough understanding of key concepts.
Step by stepSolved in 7 steps with 6 images

Knowledge Booster
Learn more about
Need a deep-dive on the concept behind this application? Look no further. Learn more about this topic, economics and related others by exploring similar questions and additional content below.Similar questions
- Fill in the table below, giving a numerical value for letters A, B, C, and D. TC AFC AVC 50 1 90 A B D 30 2.arrow_forwardQuestion 32 Which points represent a production level that could lead to unemployment? 12 10 Thousands of sedans 8 9 4 A 2 D B C 0- 0 2 4 6 8 10 12 Thousands of convertibles Full text description Selected answer will be automatically saved. For keyboard navigation, press up/down arrow keys to select an answer. Q Searcharrow_forward6. Elasticity and total revenue The following graph shows the daily demand curve for bikes in Houston. Use the green rectangle (triangle symbols) to compute total revenue at various prices along the demand curve. Note: You will not be graded on any changes made to this graph. PRICE (Dollars per bike) 300 275 ) 250 225 175 150 125 100 75 50 25 0 0 + 6 12 18 24 30 36 42 48 QUANTITY (B) Demand 54 60 66 72 Total Revenuearrow_forward
- AutoSave File Document! Word Chris Navo Home Insert Draw Design Layout References Mailings Review View MathType Help Acrobat Graphs Format Cobb and Douglas used economic data published by the government to obtain Table 2. Year P Year 1899 100 100 DOL 1911 148 216 1900 101 105 107 1912 155 1901 112 110 114 1912 1902 122 117 122 1014 169 152 244 1903 124 122 131 1915 109 156 266 1904 122 121 138 1916 225 183 1905 143 125 149 1917 227 1905 152 124 163 1915 223 201 1907 151 140 170 1919 218 19.08 126 123 485 1920 231 104 407 19.09 155 143 198 1921 179 146 417 1910 159 208 1922 240 161 431 Table 2 Swords et Predictions. The Cobb Douglass formula is P(L, K) = bLa K¹-a Determine monetary value of all the goods produced in 1 year or simply the production level in 1920 for a=.20 and b=1.01. Round to one decimal place.arrow_forwardWhat is the 4p ( Product, price, place, promotion) of caribou coffee ?arrow_forwardhi you have not specified how you got 1.152arrow_forward
arrow_back_ios
SEE MORE QUESTIONS
arrow_forward_ios
Recommended textbooks for you

 Principles of Economics (12th Edition)EconomicsISBN:9780134078779Author:Karl E. Case, Ray C. Fair, Sharon E. OsterPublisher:PEARSON
 Engineering Economy (17th Edition)EconomicsISBN:9780134870069Author:William G. Sullivan, Elin M. Wicks, C. Patrick KoellingPublisher:PEARSON
 Principles of Economics (MindTap Course List)EconomicsISBN:9781305585126Author:N. Gregory MankiwPublisher:Cengage Learning
 Managerial Economics: A Problem Solving ApproachEconomicsISBN:9781337106665Author:Luke M. Froeb, Brian T. McCann, Michael R. Ward, Mike ShorPublisher:Cengage Learning
 Managerial Economics & Business Strategy (Mcgraw-...EconomicsISBN:9781259290619Author:Michael Baye, Jeff PrincePublisher:McGraw-Hill Education


Principles of Economics (12th Edition)
Economics
ISBN:9780134078779
Author:Karl E. Case, Ray C. Fair, Sharon E. Oster
Publisher:PEARSON

Engineering Economy (17th Edition)
Economics
ISBN:9780134870069
Author:William G. Sullivan, Elin M. Wicks, C. Patrick Koelling
Publisher:PEARSON

Principles of Economics (MindTap Course List)
Economics
ISBN:9781305585126
Author:N. Gregory Mankiw
Publisher:Cengage Learning

Managerial Economics: A Problem Solving Approach
Economics
ISBN:9781337106665
Author:Luke M. Froeb, Brian T. McCann, Michael R. Ward, Mike Shor
Publisher:Cengage Learning

Managerial Economics & Business Strategy (Mcgraw-...
Economics
ISBN:9781259290619
Author:Michael Baye, Jeff Prince
Publisher:McGraw-Hill Education