Elementary Geometry For College Students, 7e
7th Edition
ISBN: 9781337614085
Author: Alexander, Daniel C.; Koeberlein, Geralyn M.
Publisher: Cengage,
expand_more
expand_more
format_list_bulleted
Question

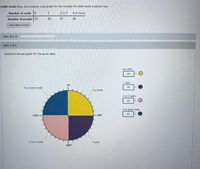
Transcribed Image Text:Credit Cards Draw and analyze a pie graph for the number of credit cards a person has.
Number of cards 0
1
2 or 3
4 or more
Number of people 53
43
67
40
Send data to Excel
Part: 0/2
Part 1 of 2
Construct the pie graph for the given data.
no cards
90
1 card
0°
4 or more cards
90
no cards
2 or 3 cards
90
4 or more cards
90
270°.
90°
2 or 3 cards
1 card
180°
Expert Solution
This question has been solved!
Explore an expertly crafted, step-by-step solution for a thorough understanding of key concepts.
This is a popular solution
Trending nowThis is a popular solution!
Step by stepSolved in 4 steps with 4 images

Knowledge Booster
Learn more about
Need a deep-dive on the concept behind this application? Look no further. Learn more about this topic, geometry and related others by exploring similar questions and additional content below.Similar questions
- Help answerarrow_forwardWhen a person in California renews the registration for an automobile, the bar graph shown below is included with the bill. BAC Zones: 90 to 109 lbs. 110 to 129 lbs. 130 to 149 lbs. 150 to 169 lbs. TIME FROM 1st DRINK TOTAL DRINKS TOTAL DRINKS TOTAL DRINKS TOTAL DRINKS 12345678123456781234567812345678 1 hr 2 hrs 3 hrs 4 hrs BAC Zones: 170 to 189 lbs. TIME FROM 1st 190 to 209 lbs. 210 to 229 lbs. 230 lbs. & up TOTAL DRINKS TOTAL DRINKS TOTAL DRINKS TOTAL DRINKS DRINK 12345678123456781234567812345678 1 hr 2 hrs 3 hrs 4 hrs PRACTICE ANOTHER SHADINGS IN THE CHARTS ABOVE MEAN: (.01% -.04%) Seldom illegal (.05% -.09%) May be illegal (.05% -.09%) Illegal if under 18 yrs. old (10% Up) Definitely illegal Use this bar graph to answer the question. The following statement is included with the graph. There is no safe way to drive after drinking. These charts show that à few drinks can make you an unsafe driver. They show that drinking affects your BLOOD ALCOHOL CONCENTRATION (BAC). The BAC zones…arrow_forwarddescibe the shape and skew. thank u, i am working on a project and am having trouble with tbis shape.arrow_forward
- 1:47 Create the graphical summary. Choose the correct graph below. O B. O A. K An Internet media and market research firm measured the amount of time an individual spends viewing a specific Webpage. The data in the accompanying table represent the amount of time, in seconds, a random sample of 40 surfers spent viewing a Webpage. Create the graphical summary. Write a sentence that describes the data. Click the icon to view the data table. Frequency Webpage Viewing Time 20+ 16- 12- mylab.pearson.com/ 8- 4- 0- 0 80 160 Viewing Time (seconds) The distribution is skewed right. The distribution is uniform. The distribution is skewed left. The distribution is bell shaped. Viewing Times (seconds) 19 86 27 42 27 20 83 4 15 26 75 27 51 111 185 51 9 73 45 27 ||| Write a sentence that describes the data. Choose the correct answer below. = 11 12 13 5 10 12 65 69 19 31 23 14 146 104 199 40 114 48 16 81 Webpage Viewing Time Print 20- 16+ 12- 8- 4- 0- 160 80 Viewing Time (seconds) Done Q O VO) 1 LTE…arrow_forwardhelparrow_forwardA student made a histogram…arrow_forward
arrow_back_ios
arrow_forward_ios
Recommended textbooks for you
 Elementary Geometry For College Students, 7eGeometryISBN:9781337614085Author:Alexander, Daniel C.; Koeberlein, Geralyn M.Publisher:Cengage,
 Elementary Geometry for College StudentsGeometryISBN:9781285195698Author:Daniel C. Alexander, Geralyn M. KoeberleinPublisher:Cengage Learning

Elementary Geometry For College Students, 7e
Geometry
ISBN:9781337614085
Author:Alexander, Daniel C.; Koeberlein, Geralyn M.
Publisher:Cengage,

Elementary Geometry for College Students
Geometry
ISBN:9781285195698
Author:Daniel C. Alexander, Geralyn M. Koeberlein
Publisher:Cengage Learning