MATLAB: An Introduction with Applications
6th Edition
ISBN: 9781119256830
Author: Amos Gilat
Publisher: John Wiley & Sons Inc
expand_more
expand_more
format_list_bulleted
Question

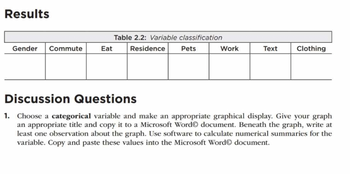
Transcribed Image Text:Results
Gender Commute
Eat
Table 2.2: Variable classification
Residence
Pets
Work
Text
Clothing
Discussion Questions
1. Choose a categorical variable and make an appropriate graphical display. Give your graph
an appropriate title and copy it to a Microsoft Word document. Beneath the graph, write at
least one observation about the graph. Use software to calculate numerical summaries for the
variable. Copy and paste these values into the Microsoft Word document.

Transcribed Image Text:METHODS
For each of the eight questions, the survey asked for values of a variable. Use Table 2.2 to classify
each of the variables as categorical (C), discrete quantitative (DQ), or continuous quantitative (CQ).
Expert Solution
This question has been solved!
Explore an expertly crafted, step-by-step solution for a thorough understanding of key concepts.
Step by stepSolved in 3 steps with 2 images

Knowledge Booster
Similar questions
- (Please do not give solution in image format thanku)arrow_forwardWhich type of graph would Be appropriate to display the percentage is in the table? line graph boxplot Histogram bar graph stemplot pie chart ?arrow_forwardThe final letter grades earned on a mathematies course are given in the table below. A B C D F W 12 20 10 4 Use a pie chart to represent this data. Write down the work leading to your answer. The last page has a protractor which you may print and use.arrow_forward
- A small organic chemistry class just took their midterm. The scores of the eight students are listed below. 65, 73, 78, 85, 87, 69, 90, 32 What type of graph could you use to represent this data? A. histogram B. bar chart C. pie chart D. stem and leaf E. All of the above O F. A and D only G. B and C only Click to select your answer. O Oarrow_forwardA group of school parents are asked how many children they have. Number of children Frequency 1 25 21 18 9. Which graph(s) would be appropriate for this data set? Select all that apply. histogram pie chart bar graph dot plotarrow_forwardSelect the graph that shows the scatterplot of the data set. Y 4 1 -5 -3 1 - 5 - 1 1 7 - 5arrow_forward
- What type of graphs( such as bar, histogram, etc) would be best to use to depict the relationship between the following variables? Please state the reason why the chosen graph was selected. 1. the association between the number of hours in the operating room and the number of hours on a bypass pump? 2. the relationship between the number of days in the ICU and gender?arrow_forwardWhich graphs are used for quantitative data? Group of answer choices Boxplot Pictogram Histogram Line Graph Bar Graph Pie Chart Stem & Leaf Plot Dot Plotarrow_forwardThe ages of people at a family party are listed. Construct an ordered stem-and-leaf diagram for the given data. Don’t forget to include your rough draft. You may want to do this on graph paper.34 54 17 26 34 25 14 24 25 23 20 18 25 19 27 26 35 36arrow_forward
- Data Management - Organization of Data for analysisarrow_forwardConsider the woman's 100 Your - and the subsequent 100 meter - in the Olympics since records have been kept determined the best way to combine all the data in depict the data would you use a histogram A-line graph a stem and leaf plot or a scatterplotarrow_forwardWhich of these can help you visualize data? Select all that apply. O bank statement O circle graph O spreadsheet O table O bar grapharrow_forward
arrow_back_ios
SEE MORE QUESTIONS
arrow_forward_ios
Recommended textbooks for you
 MATLAB: An Introduction with ApplicationsStatisticsISBN:9781119256830Author:Amos GilatPublisher:John Wiley & Sons Inc
 Probability and Statistics for Engineering and th...StatisticsISBN:9781305251809Author:Jay L. DevorePublisher:Cengage Learning
 Statistics for The Behavioral Sciences (MindTap C...StatisticsISBN:9781305504912Author:Frederick J Gravetter, Larry B. WallnauPublisher:Cengage Learning
 Elementary Statistics: Picturing the World (7th E...StatisticsISBN:9780134683416Author:Ron Larson, Betsy FarberPublisher:PEARSON
 The Basic Practice of StatisticsStatisticsISBN:9781319042578Author:David S. Moore, William I. Notz, Michael A. FlignerPublisher:W. H. Freeman
 Introduction to the Practice of StatisticsStatisticsISBN:9781319013387Author:David S. Moore, George P. McCabe, Bruce A. CraigPublisher:W. H. Freeman

MATLAB: An Introduction with Applications
Statistics
ISBN:9781119256830
Author:Amos Gilat
Publisher:John Wiley & Sons Inc

Probability and Statistics for Engineering and th...
Statistics
ISBN:9781305251809
Author:Jay L. Devore
Publisher:Cengage Learning

Statistics for The Behavioral Sciences (MindTap C...
Statistics
ISBN:9781305504912
Author:Frederick J Gravetter, Larry B. Wallnau
Publisher:Cengage Learning

Elementary Statistics: Picturing the World (7th E...
Statistics
ISBN:9780134683416
Author:Ron Larson, Betsy Farber
Publisher:PEARSON

The Basic Practice of Statistics
Statistics
ISBN:9781319042578
Author:David S. Moore, William I. Notz, Michael A. Fligner
Publisher:W. H. Freeman

Introduction to the Practice of Statistics
Statistics
ISBN:9781319013387
Author:David S. Moore, George P. McCabe, Bruce A. Craig
Publisher:W. H. Freeman