
MATLAB: An Introduction with Applications
6th Edition
ISBN: 9781119256830
Author: Amos Gilat
Publisher: John Wiley & Sons Inc
expand_more
expand_more
format_list_bulleted
Related questions
Question
Create a histogram of the actors' age data using Excel
- First we need to define the bins that Excel will use to create the histogram. In this case, our minimum data point is 31, and our max is 76. We'll use a bin width of 5, and make bins from 30 to 80:
- In one of the columns near the data, enter these numbers: 30, 35, 40, 45, etc., up to 80.
- Now click the Data tab and select the Data Analysis button. Then choose Histogram in the resulting pop-up window and click OK.
- In the next window, click in the box next to Input
Range and select the cells containing your data. - Then click in the box next to Bin Range and then select the cells containing your bin information.
- Finally, check the box at the bottom of this window marked Chart Output, and then click OK.
- Excel will create a new worksheet containing the histogram and a table with the frequency counts. The histogram is usually pretty small; you can click on it and then drag one of the handles on the outside to enlarge it.
- Histograms shouldn't have spaces between the bars, so right-click on one of the bars and choose Format Data Series. Once the Format Data Series window appears set the gap width to 0% (No Gap).
- Before closing the Format Data Series window, click on Fill & Line tab (paint bucket) on the left, click the Border and select Solid line, and set the color to black.
- Close the Format Data Series window by clicking the X button. You will now see the histogram graph with the new border changes.
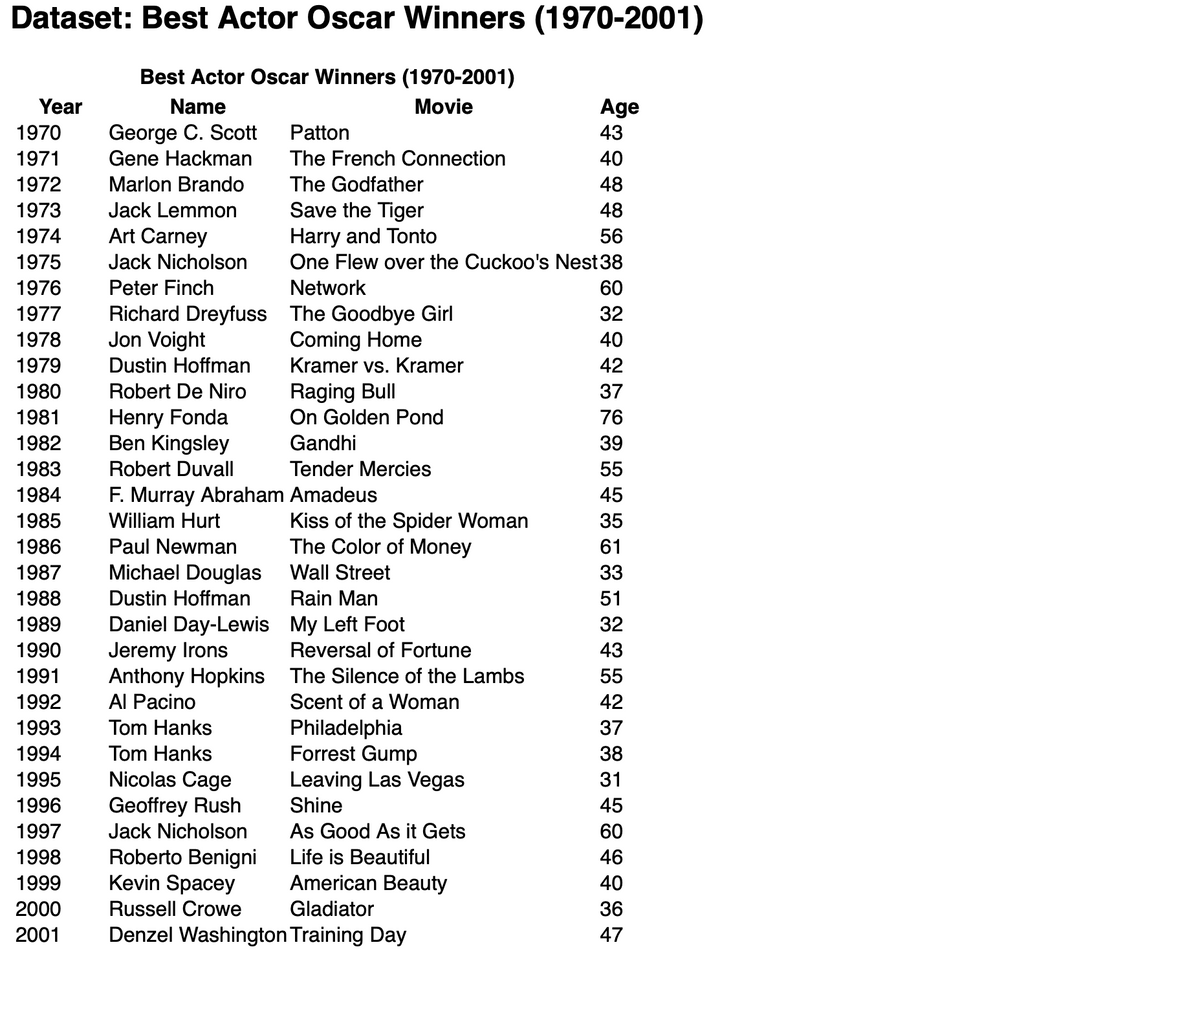

Transcribed Image Text:Dataset: Best Actor Oscar Winners (1970-2001)
Best Actor Oscar Winners (1970-2001)
Name
George C. Scott
Movie
Gene Hackman
Marlon Brando
Year
1970
1971
1972
1973
1974
1975
1976
1977
1978
1979
1980
1981
1982
1983
1984
1985
1986
1987
1988
1989
1990
1991
1992
1993
1994
1995
Nicolas Cage
1996
Geoffrey Rush
1997
Jack Nicholson
1998
Roberto Benigni
1999
Kevin Spacey
Russell Crowe
2000
2001 Denzel Washington Training Day
Jack Lemmon
Art Carney
Jack Nicholson
Peter Finch
Richard Dreyfuss
Jon Voight
Dustin Hoffman
Robert De Niro
Henry Fonda
Ben Kingsley
Robert Duvall
F. Murray Abraham
William Hurt
Paul Newman
Michael Douglas
Dustin Hoffman
Daniel Day-Lewis
Jeremy Irons
Anthony Hopkins
Al Pacino
Tom Hanks
Tom Hanks
Patton
The French Connection
The Godfather
Save the Tiger
Harry and Tonto
One Flew over the Cuckoo's Nest 38
Network
The Goodbye Girl
Coming Home
Kramer vs. Kramer
Raging Bull
On Golden Pond
Gandhi
Tender Mercies
Amadeus
Kiss of the Spider Woman
The Color of Money
Wall Street
Rain Man
My Left Foot
Reversal of Fortune
The Silence of the Lambs
Scent of a Woman
Philadelphia
Forrest Gump
Leaving Las Vegas
Shine
PHONG76684496858±±±6%54848+
As Good As it Gets
Life is Beautiful
American Beauty
Gladiator
Age
43
40
60
32
40
42
37
39
35
61
33
51
32
43
42
37
38
31
60
40
36
Expert Solution
This question has been solved!
Explore an expertly crafted, step-by-step solution for a thorough understanding of key concepts.

This is a popular solution

Trending nowThis is a popular solution!

Step by stepSolved in 3 steps with 7 images

Knowledge Booster

Similar questions
- Hi i’m in grade 12 Data Management and i need help with this practice questionarrow_forwardAn insurance company crashed four cars in succession at 5 miles per hour. The cost of repair for each of the crashes was $421,$465,$412,$218. Compute the range of dataarrow_forwardKindly answer 1-2arrow_forward
- Paolo studies bees and honey production. He gathers data on the bee population of a honeycomb and theamount of honey produced for both wild bees and farm bees. Identify the type of study and what relationship is beingexamined.arrow_forwardThe whole data set will be in the two picturesarrow_forwardList the most important data types. &tell Two example for Eacharrow_forward
- Hillary and Devin will collect data to find out where the seventh-grade students should take their field trip. Which group should Hillary and Devin survey to collect the best data?arrow_forwardPlease solve with the full step and no reject thank uarrow_forwardA ✩ The box-and-whisker plot below represents the length, in inches, of 20 trout caught at Raystown Lake in one weekend. 4466619/varlants/5145485/take/5/ 10 Length of Trout (inches) H 15 20 H 25 30 How many trout were less than 20 inches long? Hint: 20 inches is the upper quartile of the box-and- whisker plot. So, 75% of the trout were less than 20 inches long. To find the answer: multiply the percentage (75%) x 20 (the number of inches) We use 75% because that is the Q3 in the data. 25% would be our Q1 and 50% is the median (or Q2).arrow_forward
- Find the range for this list of numbers 4 35 58 97 22 29 7 78 11 46 93 66 27 54 Range %3Darrow_forwardqdes.c A study was undertaken to see how accurate food labeling for calories on food that is considered "reduced calorie". The group measured the amount of calories for each item of food and then found the percent difference between measured and labeled food. The group also looked at food that was nationally advertised, regionally distributed, or locally prepared. The data is in the following table ("Calories datafile," 2013). Table: Percent Differences Between Measured and Labeled Food National Advertised Regionally Distributed Locally Prepared 2 41 15 -28 46 60 -6 2 250 8 25 145 6 39 6 -1 16.5 80 10 17 95 13 28 3 15 -3 -4 14 -4 34 -18 42 10 5 3 -7 3 -0.5 -10 6 Do the data indicate that at least two of the mean percent differences between the three groups are different?…arrow_forwardThe box plots below show how fast cars are travelling at a specific time of a day on highway I-5 and l-405 in King county. Fill in the blank. I-405 I-5 45 50 55 60 65 70 75 Speed (miles per hour) If Jay is driving at the median speed on l-5, he is driving faster than % of drivers on l-405.arrow_forward
arrow_back_ios
SEE MORE QUESTIONS
arrow_forward_ios
Recommended textbooks for you
- MATLAB: An Introduction with ApplicationsStatisticsISBN:9781119256830Author:Amos GilatPublisher:John Wiley & Sons Inc
 Probability and Statistics for Engineering and th...StatisticsISBN:9781305251809Author:Jay L. DevorePublisher:Cengage Learning
 Statistics for The Behavioral Sciences (MindTap C...StatisticsISBN:9781305504912Author:Frederick J Gravetter, Larry B. WallnauPublisher:Cengage Learning
  Elementary Statistics: Picturing the World (7th E...StatisticsISBN:9780134683416Author:Ron Larson, Betsy FarberPublisher:PEARSON
 The Basic Practice of StatisticsStatisticsISBN:9781319042578Author:David S. Moore, William I. Notz, Michael A. FlignerPublisher:W. H. Freeman
 Introduction to the Practice of StatisticsStatisticsISBN:9781319013387Author:David S. Moore, George P. McCabe, Bruce A. CraigPublisher:W. H. Freeman
MATLAB: An Introduction with Applications
Statistics
ISBN:9781119256830
Author:Amos Gilat
Publisher:John Wiley & Sons Inc
Probability and Statistics for Engineering and th...
Statistics
ISBN:9781305251809
Author:Jay L. Devore
Publisher:Cengage Learning
Statistics for The Behavioral Sciences (MindTap C...
Statistics
ISBN:9781305504912
Author:Frederick J Gravetter, Larry B. Wallnau
Publisher:Cengage Learning
Elementary Statistics: Picturing the World (7th E...
Statistics
ISBN:9780134683416
Author:Ron Larson, Betsy Farber
Publisher:PEARSON
The Basic Practice of Statistics
Statistics
ISBN:9781319042578
Author:David S. Moore, William I. Notz, Michael A. Fligner
Publisher:W. H. Freeman
Introduction to the Practice of Statistics
Statistics
ISBN:9781319013387
Author:David S. Moore, George P. McCabe, Bruce A. Craig
Publisher:W. H. Freeman