
MATLAB: An Introduction with Applications
6th Edition
ISBN: 9781119256830
Author: Amos Gilat
Publisher: John Wiley & Sons Inc
expand_more
expand_more
format_list_bulleted
Related questions
Question
thumb_up100%
Creat a grouped frequency Distribution for one continuous variable in this data set . Then creat a histogram and frequency
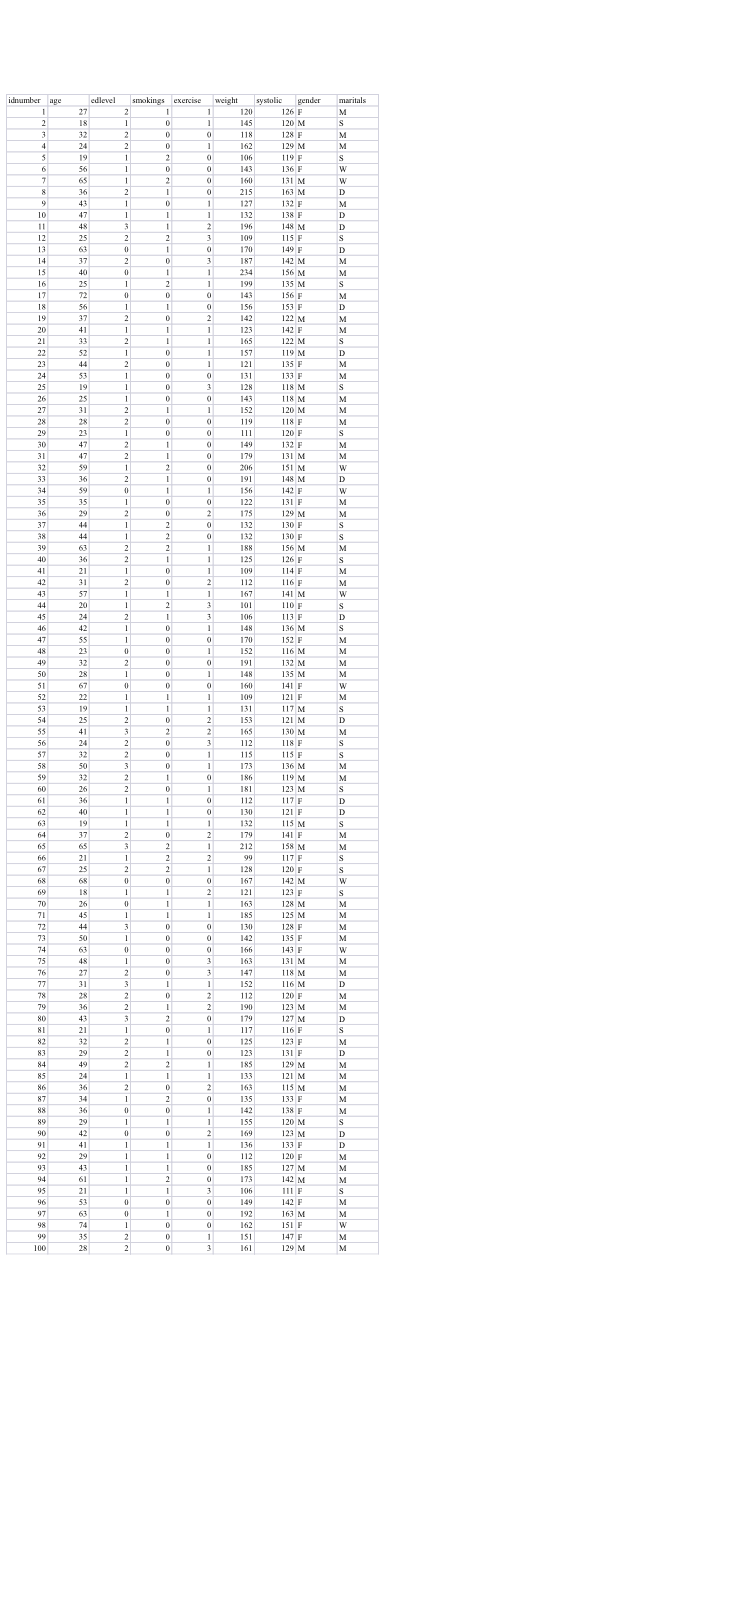

Transcribed Image Text:### Data Table Overview
The table presented below displays a comprehensive dataset related to health metrics, demographics, and lifestyle factors. Each row in the table represents an individual record with specific attributes, which include:
1. **ID Number:** A unique identifier for each individual.
2. **Age:** The age of the individual.
3. **Cldlevel:** Cholesterol level category.
4. **Smokings:** Smoking status (indicates smoking habits).
5. **Exercise:** Indicator of exercise frequency or intensity.
6. **Weight:** Weight of the individual.
7. **Systolic:** Systolic blood pressure.
8. **Gender:** Gender of the individual (M for Male, F for Female).
9. **Marritals:** Marital status of the individual.
### Detailed Data Description
| idnumber | age | cldlevel | smokings | exercise | weight | systolic | gender | marritals |
|----------|-----|----------|----------|----------|--------|----------|--------|-----------|
| 1 | 27 | 2 | 1 | 0 | 120 | 126 | F | M |
| 2 | 18 | 1 | 2 | 0 | 145 | 120 | M | S |
| 3 | 32 | 2 | 1 | 0 | 118 | 128 | F | M |
| 4 | 24 | 1 | 0 | 1 | 162 | 129 | M | M |
| 5 | 19 | 2 | 2 | 0 | 106 | 119 | F | S |
| 6 | 56 | 1 | 0 | 0 | 143 | 136 | F | W |
| 7 | 65 | 2 | 2 | 0 | 160 | 131 | M | W |
| 8 | 36 | 1 | 1 | 0 | 215 | 163 | M | D |
| 9 | 43 | 1
Expert Solution
This question has been solved!
Explore an expertly crafted, step-by-step solution for a thorough understanding of key concepts.

This is a popular solution

Trending nowThis is a popular solution!

Step by stepSolved in 4 steps with 3 images

Knowledge Booster


Learn more about
Need a deep-dive on the concept behind this application? Look no further. Learn more about this topic, statistics and related others by exploring similar questions and additional content below.Similar questions
- The accompanying histogram is for pulse rates for 125 people. Convert the vertical axis to relative frequency and shows the values that would replace each of the values on the vertical axis.arrow_forwardPlease do not give solution in image format thanku A car salesman collected data on how many cars were sold at a dealership per day for two weeks. The results were as follows: 6, 7, 4, 3, 1, 2, 6, 6, 6, 7, 4, 4. Make a frequency table and then make a histogram based on that frequency table. What is the shape of the distribution? O Skewed to the right O Skewed to the left O Bimodal O Symmetricalarrow_forwardFind the mean of the data from the frequency table: Value Frequency 0 6 1 0 2 6 3 8 4 9 5 6 Give your answer to two decimal places.arrow_forward
- The heights and weights of a set of students were recorded on a scatter graph. Describe the correlation depicted below: Select- strong, moderate, weak and Select- positive, negativearrow_forwardData Management - Organization of Data for analysisarrow_forwardThe entirety of the data set will be in the two picturesarrow_forward
- Which of the following is NOT an appropriate display for the variable of Grade Point Average? Group of answer choices Dot Plot Scatterplot Boxplot Stem and Leaf Plot Histogramarrow_forwardQuestion 9 The first quartile (Q1) corresponds to the The median corresponds to the th The third quartile (Q3) corresponds to the th percentile. percentile. th percentile.arrow_forwardAt a local supermarket, a group of taste-testers were asked to rate a new food product on a scale of 1 to 5, ranging from bad taste through excellent taste. Identify the most appropriate graph to describe the given data. histogram scatterplot bar graph stem-and-leaf plotarrow_forward
- The frequency distribution to the right shows the various levels of demand for a particular laptop computer sold by a store during the last 50 business days. Determine the average number of laptops sold per day. Number of Laptops Frquency 0 251 52 63 114 15 2arrow_forwardA professor went to a website for rating professors and looked up the quality rating and also the "easiness" of the six full-time professors in one department. The ratings are 1 (lowest quality) to 5 (highest quality) and 1 (hardest) to 5 (easiest). The numbers given are averages for each professor. Assume the trend is linear, find the correlation, and comment on what it means. Calculate the correlation. r = (Round to three decimal places as needed.) Comment on the meaning of the correlation. Choose the correct interpretation below. OA. The professors that have high easiness scores tend to also have low quality scores.. OB. Being "easy" as a professor causes students to regard the professor as having a higher quality. OC. The professors that have high easiness scores tend to also have high quality scores. OD. Being "easy" as a professor causes students to regard the professor as having a lower quality. Quality Easiness D 4.7 3.7 4.7 3.1 4.2 3.5 4.2 2.6 3.9 1.9 3.5 1.8arrow_forwardWhich of the following sets of data represent valid functions? OF={(-2,- 4), (1, 3), (5, 4), (7, 8), (10, 15)} OR={(1, - 2), (1, 3), (5, 6), (8, 9), (14, 12)} OG= {(-3, 2), (1, 2), (6, 4), (3, 2), (13, 14)} OS = {(1, 5), (2, 1), (2, 4), (8, 7), (15, 14)} Calculator Check Answerarrow_forward
arrow_back_ios
SEE MORE QUESTIONS
arrow_forward_ios
Recommended textbooks for you
- MATLAB: An Introduction with ApplicationsStatisticsISBN:9781119256830Author:Amos GilatPublisher:John Wiley & Sons Inc
 Probability and Statistics for Engineering and th...StatisticsISBN:9781305251809Author:Jay L. DevorePublisher:Cengage Learning
 Statistics for The Behavioral Sciences (MindTap C...StatisticsISBN:9781305504912Author:Frederick J Gravetter, Larry B. WallnauPublisher:Cengage Learning
  Elementary Statistics: Picturing the World (7th E...StatisticsISBN:9780134683416Author:Ron Larson, Betsy FarberPublisher:PEARSON
 The Basic Practice of StatisticsStatisticsISBN:9781319042578Author:David S. Moore, William I. Notz, Michael A. FlignerPublisher:W. H. Freeman
 Introduction to the Practice of StatisticsStatisticsISBN:9781319013387Author:David S. Moore, George P. McCabe, Bruce A. CraigPublisher:W. H. Freeman
MATLAB: An Introduction with Applications
Statistics
ISBN:9781119256830
Author:Amos Gilat
Publisher:John Wiley & Sons Inc
Probability and Statistics for Engineering and th...
Statistics
ISBN:9781305251809
Author:Jay L. Devore
Publisher:Cengage Learning
Statistics for The Behavioral Sciences (MindTap C...
Statistics
ISBN:9781305504912
Author:Frederick J Gravetter, Larry B. Wallnau
Publisher:Cengage Learning
Elementary Statistics: Picturing the World (7th E...
Statistics
ISBN:9780134683416
Author:Ron Larson, Betsy Farber
Publisher:PEARSON
The Basic Practice of Statistics
Statistics
ISBN:9781319042578
Author:David S. Moore, William I. Notz, Michael A. Fligner
Publisher:W. H. Freeman
Introduction to the Practice of Statistics
Statistics
ISBN:9781319013387
Author:David S. Moore, George P. McCabe, Bruce A. Craig
Publisher:W. H. Freeman