
Advanced Engineering Mathematics
10th Edition
ISBN: 9780470458365
Author: Erwin Kreyszig
Publisher: Wiley, John & Sons, Incorporated
expand_more
expand_more
format_list_bulleted
Related questions
Question
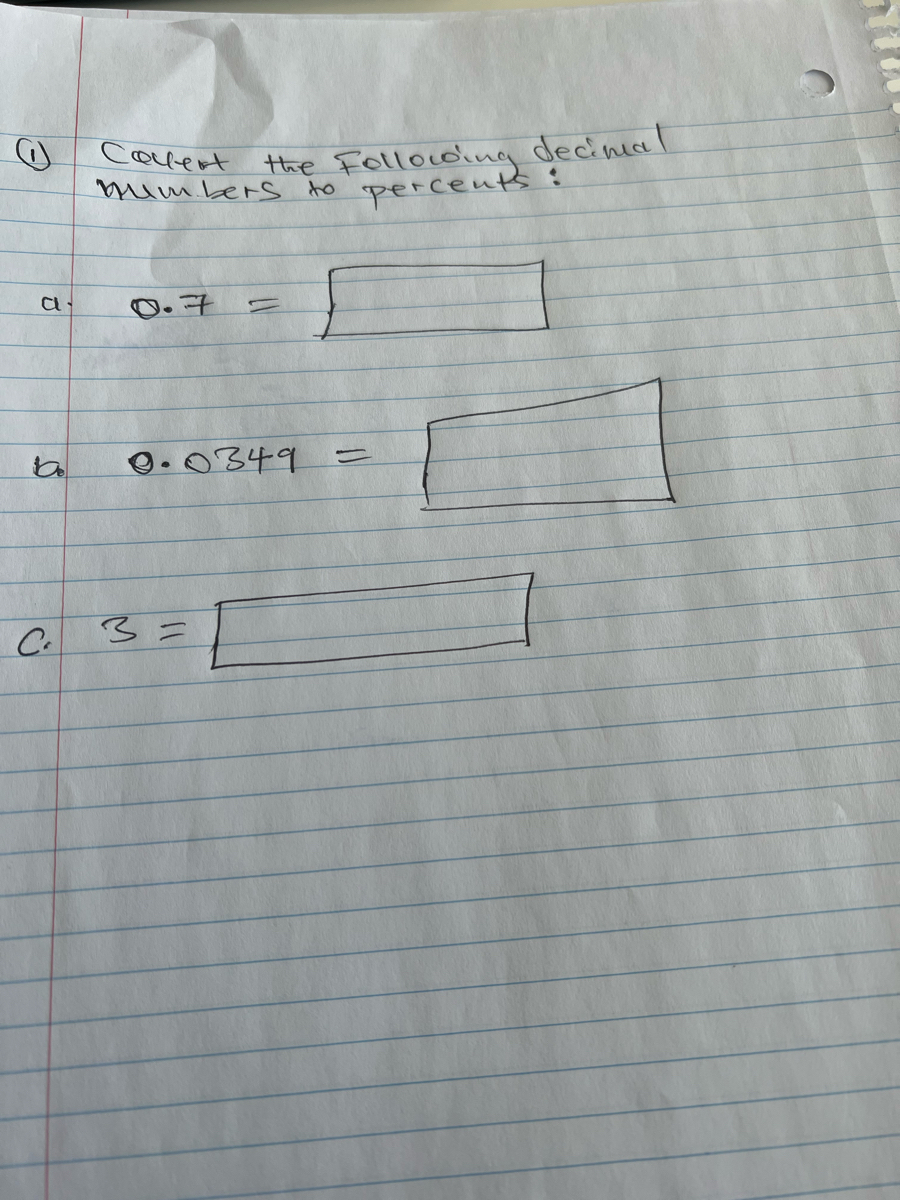

Transcribed Image Text:Covert
decinical
the Follocoing
percents
hid
mumbers to
O.0349
C.
3 =
Expert Solution
This question has been solved!
Explore an expertly crafted, step-by-step solution for a thorough understanding of key concepts.

Step by stepSolved in 2 steps with 2 images

Knowledge Booster

Similar questions
- #I A famous NBA Player t a laçal ht spot n avenağe gnce elery Manth What s the extected nuMcert af appearances by thes NBA payer ot theslocal hot spot Pn a yeN. %23 ht Spot on average once elerarrow_forwardTotal Food Delivered (kg) 8. Figure 1- Modeling based on penguin data shows that the percentage of sea ice has an effect on the efficiency of Adélie penguin foraging. This graph shows the modeled effect of sea ice concentration on total mass of food delivered, per parent. Maximum efficiency is reached at about 12% but doesn't change for higher ice concentrations. Dotted lines indicate range of probable values. Graph modified from Ballard and others (2010). 10 Ice Concentration (%) 15. Look at the dotted lines on figure 1. Which statement is BEST supported by these dotted lines? It is likely that the least amount of food delivered by a single parent is about 5.0 kg It is likely that the least amount of food delivered by a single parent is about 4.5 kg. B.arrow_forwardQUESTION 25 Insert , or = between the quantities to make a true comparison. 5/64 20/4 a. b. %3D OUESTION 26 VAarrow_forward
- number of fruits spoiled frequency 0 3 1 14 2 11 3 9 4 9 5 2 6 2 7 3 14 1 25 1 build a steam and leaf chart with the information abovearrow_forwardDaily High Temperature Application The table below shows the daily high temperatures in northern Washington during one week in January in the early 2000's. What was the average daily high temperature for that week? Round your answer to one decimal place. Day Temperature Mon. Tue Wed. Thu. Fri Sat Sun -4° -7° -2° The average temperature for the week was Fahrenheit. 0° 2° -5° -8° degreesarrow_forwardll Sprint Wi-Fi ? 9:50 AM 48% C.C. 11.1 - 11.2 2 of 7 00:06 / 30:00 Find the diameter of a circle with an area of 27.2 square centimeters. about 8.66 cm about 4.33 cm about 2.94 cm about 5.88 cm Next >arrow_forward
- D2L Hawkes SSO ( X Lesson 4.8 Pra X D2L B.6 Process Pa X y google Yaho X X A Answers - The X y! percent to de X learn.hawkeslearning.com/Portal/Lesson/lesson_practice#! - Save & Exit Practice Lesson: 4.8 Simple and Compound Interest MARTIKA GRC Question 1 of 9, Step 1 of 1 0/9 Correct If the value of your house is $169,000 today and inflation is constant at 10.7% annually, what will be its value, to the nearest thousand dollars, in 7 years? Answer How to enter your answer (opens in new window) Keyboard $ I G answers.com Σ Percent to Dearrow_forwardMatch the level of measure to the example. Group of answer choices: Color of an M& M: [ Choose ] Ratio Ordinal Interval Nominal Weight of an M&M [ Choose ] Ratio Ordinal Interval Nominal Temperature at which an M&M melts in your hand [ Choose ] Ratio Ordinal Interval Nominalarrow_forwardneeded help calculating Barrow_forward
- fastarrow_forwardMatch the coefficient of determination to the scatter diagram. The scales on the x-axis andy-axis ar the same for each scatter diagram. (a) R2 = 1, (b) R2 = 0.98, (c) R2 = 0.65 Match each scatter diagram (I, II, and III) to the below. The diagrams are attached in the image. (a) Scatter diagram ______ (b) Scatter diagram ______ (c) Scatter diagram _______arrow_forwardProportion by eclass 0.0 0.4 0.8 Yes(G) Convict (yes=1; no=0) No(1) 000 3 2 1 Examine the stacked/segmented stacked bar chart displayed in this Figure. It explores the relationship between eclass and convict. What can you conclude regarding this relationship?arrow_forward
arrow_back_ios
arrow_forward_ios
Recommended textbooks for you
- Advanced Engineering MathematicsAdvanced MathISBN:9780470458365Author:Erwin KreyszigPublisher:Wiley, John & Sons, Incorporated
 Numerical Methods for EngineersAdvanced MathISBN:9780073397924Author:Steven C. Chapra Dr., Raymond P. CanalePublisher:McGraw-Hill Education
 Introductory Mathematics for Engineering Applicat...Advanced MathISBN:9781118141809Author:Nathan KlingbeilPublisher:WILEY
  Mathematics For Machine TechnologyAdvanced MathISBN:9781337798310Author:Peterson, John.Publisher:Cengage Learning,

Advanced Engineering Mathematics
Advanced Math
ISBN:9780470458365
Author:Erwin Kreyszig
Publisher:Wiley, John & Sons, Incorporated
Numerical Methods for Engineers
Advanced Math
ISBN:9780073397924
Author:Steven C. Chapra Dr., Raymond P. Canale
Publisher:McGraw-Hill Education
Introductory Mathematics for Engineering Applicat...
Advanced Math
ISBN:9781118141809
Author:Nathan Klingbeil
Publisher:WILEY
Mathematics For Machine Technology
Advanced Math
ISBN:9781337798310
Author:Peterson, John.
Publisher:Cengage Learning,