
MATLAB: An Introduction with Applications
6th Edition
ISBN: 9781119256830
Author: Amos Gilat
Publisher: John Wiley & Sons Inc
expand_more
expand_more
format_list_bulleted
Related questions
Question

Transcribed Image Text:Course Home
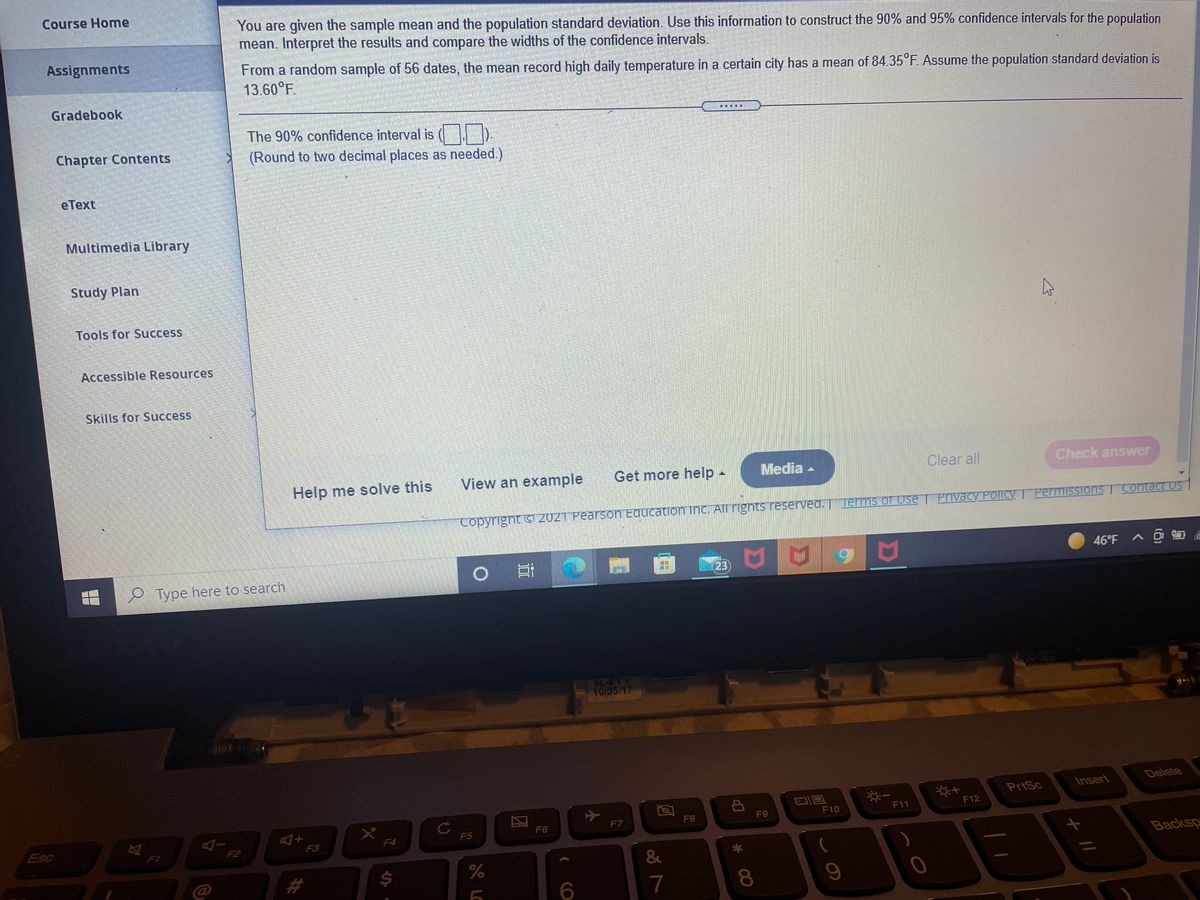
You are given the sample mean and the population standard deviation. Use this information to construct the 90% and 95% confidence intervals for the population
mean. Interpret the results and compare the widths of the confidence intervals.
Assignments
From a random sample of 56 dates, the mean record high daily temperature in a certain city has a mean of 84.35°F. Assume the population standard deviation is
13.60°F.
Gradebook
The 90% confidence interval is
Chapter Contents
(Round to two decimal places as needed.)
eТext
Multimedia Library
Study Plan
Tools for Success
Accessible Resources,
Skills for Success
Help me solve this
View an example
Get more help-
Media -
Clear all
Check answer
Permissions
Contact Us
Copyright c 2021 Pearson Equcation ihc. All rights reserved. lerms of Use| Privacy Policy
46°F A @ O a
23
Type here to search
XL-BTY
10/05/17
Insert
Delete
PriSc
F11
F12
F9
F10
F7
F8
Esc
F5
F6
F2
F3
F4
F1
Backsp
&
7
080
LC
%24
Expert Solution
This question has been solved!
Explore an expertly crafted, step-by-step solution for a thorough understanding of key concepts.

This is a popular solution

Trending nowThis is a popular solution!

Step by stepSolved in 2 steps with 2 images

Knowledge Booster

Similar questions
- You are given the sample mean and the population standard deviation. Use this information to construct the 90% and 95% confidence intervals for the population mean. Interpret the results and compare the widths of the confidence intervals. If convenient, use technology to construct the confidence intervals. A random sample of 35 home theater systems has a mean price of $145.00. Assume the population standard deviation is $18.10. Construct a 90% confidence interval for the population mean. The 90% confidence interval is (139.97, 150.03). (Round to two decimal places as needed.) Construct a 95% confidence interval for the population mean. The 95% confidence interval is ( 139 , 151). (Round to two decimal places as needed.) Interpret the results. Choose the correct answer below O A. With 90% confidence, it can be said that the sample mean price lies in the first interval. With 95% confidence, it can be said that the sample mean price lies in the second interval. The 95% confidence interval…arrow_forwardYou are given the sample mean and the population standard deviation. Use this information to construct the 90% and 95% confidence intervals for the population mean. Interpret the results and compare the widths of the confidence intervals. From a random sample of 74 dates, the mean record high daily temperatur in a certain city has a mean of 85.27°F. Assume the population standard deviation is 14.71°F. Which interval is wider? Choose the correct answer below. The 95% confidence interval O The 90% confidence interval Interpret the results. A. You can be 90% confident that the population mean record high temperature is between the bounds of the 90% confidence interval, and 95% confident for the 95% interval. B. You can be certain that the mean record high temperature was within the 90% confidence interval for approximately 67 of the 74 days, and was within the 95% confidence interval for approximately 70 of the 74 days. C. You can be certain that the population mean record high…arrow_forwardThe mean of a sample of 21 people who were playing the slot machines is 50.6 years, and the standard deviation is 6.8 years. The mean age of a sample of 30 people who were playing roulette is 53.6 with a standard deviation of 3.2 years. Can it be concluded at a=0.01 that mean age of those playing the slot machines is less than those playing roulette? Only typing answer Please answer explaining in detail step by step without table and graph thankyouarrow_forward
- R4arrow_forwardYou are given the sample mean and the population standard deviation. Use this information to construct the 90% and 95% confidence intervals for the population mean. Interpret the results and compare the widths of the confidence intervals. If convenient, use technology to construct the confidence intervals. A random sample of 35 home theater systems has a mean price of$134.00. Assume the population standard deviation is $18.70. Construct a 90% confidence interval for the population mean. The 90% confidence interval is _____ (Round to two decimal places as needed) Construct a 95% confidence interval for the population mean. The 95% confidence interval is _____ (Round to two decimal places as needed)arrow_forwardThe mean mark on a state-administered mathematics exam by a 10th grade class in Smalltown, Wisconsin, was 95%, while the mean mark on the same exam by 10th grade students in the entire state of Wisconsin was reported to be only 78%. This suggests that the mean can be __________. a a parameter or a statistic b a parameter only c a statistic only d neither a parameter nor a statisticarrow_forward
- You are given the sample mean and the population standard deviation. Use this information to construct the 90% and 95% confidence intervals for the population mean. Interpret the results and compare the widths of the confidence intervals. If convenient, use technology to construct the confidence intervals. A random sample of 55 home theater systems has a mean price of $117.00.Assume the population standard deviation is $17.40. Construct a 90% confidence interval for the population mean. The 90% confidence interval is (enter your response here,enter your response here). (Round to two decimal places as needed.) Construct a 95% confidence interval for the population mean. The 95% confidence interval is (enter your response here,enter your response here). (Round to two decimal places as needed.) Interpret the results. Choose the correct answer below. A. With 90% confidence, it can be said that the population mean price lies in the first…arrow_forwardYou are given the sample mean and the population standard deviation. Use this information to construct the 90% and 95% confidence intervals for the population mean. Interpret the results and compare the widths of the confidence intervals. If convenient, use technology to construct the confidence intervals A random sample of 50 home theater systems has a mean price of $125.00. Assume the population standard deviation is $16.40. Construct a 90% confidence interval for the population mean. The 90% confidence interval is ( | ). (Round to two decimal places as needed.) Construct a 95% confidence interval for the population mean. The 95% confidence interval is ( ) (Round to two decimal places as needed.) Interpret the results. Choose the correct answer below. O A. With 90% confidence, it can be said that the population mean price lies in the first interval. With 95% confidence, it can be said that the population mean price lies in the second interval. The 95% confidence interval is wider…arrow_forwardYou are given the sample mean and the population standard deviation. Use this information to construct the 90% and 95% confidence intervals for the population mean. Interpret the results and compare the widths of the confidence intervals. If convenient, use technology to construct the confidence intervals. A random sample of 35 home theater systems has a mean price of $145.00. Assume the population standard deviation is $18.10. Construct a 90% confidence interval for the population mean. The 90% confidence interval is ( D. (Round to two decimal places as needed.) S... el R... 1o-Insta... PDF DRA 2021 Deputy Incidents.pdf Enter your answer in the edit fields and then click Check Answer. 2 parts remaining Clear All Check Answer Riley LAMAarrow_forward
- K You are given the sample mean and the population standard deviation. Use this information to construct the 90% and 95% confidence intervals for the population mean. Interpret the results and compare the widths of the confidence intervals. If convenient, use technology to construct the confidence intervals. A random sample of 35 home theater systems has a mean price of $131.00. Assume the population standard deviation is $15.50. Construct a 90% confidence interval for the population mean. The 90% confidence interval is (). (Round to two decimal places as needed.) Warrow_forwardNeed to solve for 95% interval and 90% intervalarrow_forwardCereals sodium values have a mean of 167 and a standard deviation of 77.3. Find the z-score for the cereal that has a sodium value of 0. How would you interpret this z-score?arrow_forward
arrow_back_ios
SEE MORE QUESTIONS
arrow_forward_ios
Recommended textbooks for you
- MATLAB: An Introduction with ApplicationsStatisticsISBN:9781119256830Author:Amos GilatPublisher:John Wiley & Sons Inc
 Probability and Statistics for Engineering and th...StatisticsISBN:9781305251809Author:Jay L. DevorePublisher:Cengage Learning
 Statistics for The Behavioral Sciences (MindTap C...StatisticsISBN:9781305504912Author:Frederick J Gravetter, Larry B. WallnauPublisher:Cengage Learning
  Elementary Statistics: Picturing the World (7th E...StatisticsISBN:9780134683416Author:Ron Larson, Betsy FarberPublisher:PEARSON
 The Basic Practice of StatisticsStatisticsISBN:9781319042578Author:David S. Moore, William I. Notz, Michael A. FlignerPublisher:W. H. Freeman
 Introduction to the Practice of StatisticsStatisticsISBN:9781319013387Author:David S. Moore, George P. McCabe, Bruce A. CraigPublisher:W. H. Freeman
MATLAB: An Introduction with Applications
Statistics
ISBN:9781119256830
Author:Amos Gilat
Publisher:John Wiley & Sons Inc
Probability and Statistics for Engineering and th...
Statistics
ISBN:9781305251809
Author:Jay L. Devore
Publisher:Cengage Learning
Statistics for The Behavioral Sciences (MindTap C...
Statistics
ISBN:9781305504912
Author:Frederick J Gravetter, Larry B. Wallnau
Publisher:Cengage Learning
Elementary Statistics: Picturing the World (7th E...
Statistics
ISBN:9780134683416
Author:Ron Larson, Betsy Farber
Publisher:PEARSON
The Basic Practice of Statistics
Statistics
ISBN:9781319042578
Author:David S. Moore, William I. Notz, Michael A. Fligner
Publisher:W. H. Freeman
Introduction to the Practice of Statistics
Statistics
ISBN:9781319013387
Author:David S. Moore, George P. McCabe, Bruce A. Craig
Publisher:W. H. Freeman