
MATLAB: An Introduction with Applications
6th Edition
ISBN: 9781119256830
Author: Amos Gilat
Publisher: John Wiley & Sons Inc
expand_more
expand_more
format_list_bulleted
Related questions
Question
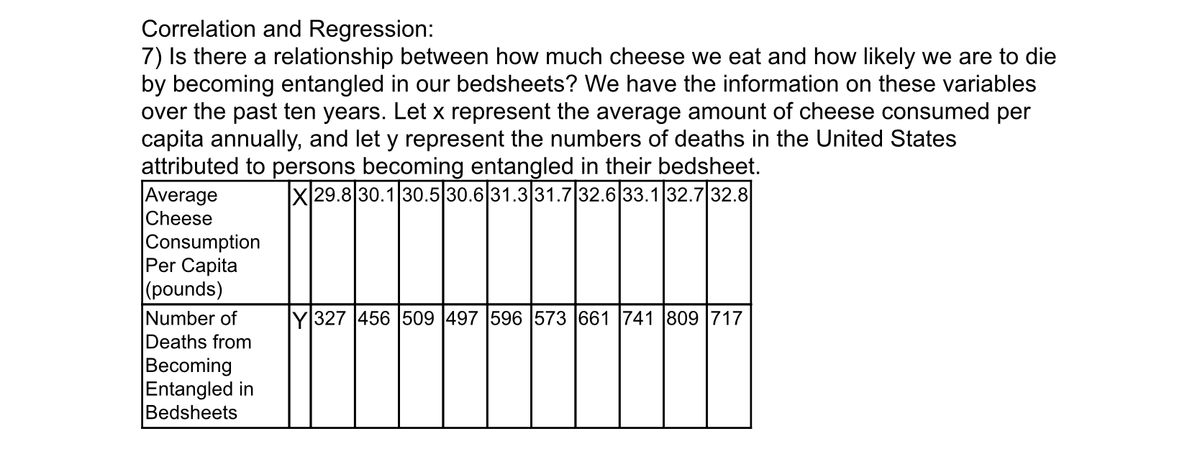

Transcribed Image Text:Correlation and Regression:
7) Is there a relationship between how much cheese we eat and how likely we are to die
by becoming entangled in our bedsheets? We have the information on these variables
over the past ten years. Let x represent the average amount of cheese consumed per
capita annually, and let y represent the numbers of deaths in the United States
attributed to persons becoming entangled in their bedsheet.
X|29.8 30.1 30.5 30.6 31.3 31.7|32.6|33.1 32.7|32.8|
Average
Cheese
Consumption
Per Capita
(pounds)
Number of
Deaths from
Becoming
Entangled in
Bedsheets
Y 327 456 509 497 596 573 661 741 809 717

Transcribed Image Text:d)
Find the coefficient of determination, r². Explain what it means in the
context of this problem.
Provide examples of other lurking variables that may have an effect on
the number of deaths experienced in the United States each year as a result of
becoming entangled in bedsheets other than the average amount of cheese
consumed per person.
f)
Predict the number of deaths from entanglement in bedsheets expected
if the average amount of cheese consumed is 31 pounds.
Expert Solution
This question has been solved!
Explore an expertly crafted, step-by-step solution for a thorough understanding of key concepts.

This is a popular solution

Trending nowThis is a popular solution!

Step by stepSolved in 4 steps

Knowledge Booster

Similar questions
- Solve attached photo.arrow_forwardLife Expectancies Is there a relationship between the life expectancy for men and the life expectancy for women in a given country? A random sample of nonindustrialized countries was selected, and the life expectancy in years is listed for both men and women. Are the variables linearly related? Men 60.2, 43.9, 59.8, 66.1, 68.4, 64.8 Women 60.0, 43.8, 56.6, 72.7, 63.5, 66 Draw the scatter plot for the variables. Compute the value of the correlation coefficient r= state the hypothesis h0: h1: critical value(s) reject or accept the null hypothesis Give a brief explanation of the type of relationshiparrow_forwardListed. below are paired data consisting of movie budget amounts and the amounts that the movies grossed. Find the regression equation, letting the budget be the predictor (x) variable. Find the best predicted amount that a movie will gross if its budget is $115 million. Use a significance level of a = 0.05. Budget ($)in Millions Gross ($) in Millions 41 21 114 68 79 51 118 65 9. 61 122 21 15 151 110 119 11 107 56 128 116 101 107 55 105 222 39 22 283 45 Click the icon to view the critical values of the Pearson correlation coefficient r. The regression equation is y%= X. %3D (Round to one decimal place as needed.)arrow_forward
- A. run a simple regression- dependent variable is Weeks, independent variable is Age. B. run a multiple regression with dependent variable weeks and independent variable-age, married, head, manager and sales. C. Create the regular and standardized residual plots for both. Please show the tables when entering values of the regression for both the outputs and the scatter plots.arrow_forwardK An institution reports many demographic statistics about countries of the world. Data were collected about the Fertility rate (births per woman) and the female Life Expectancy at birth (in years) for 200 countries of the world. The regression output and a scatterplot of the data are shown below. Complete parts a through d below. Response variable is: Life expectancy 219 total cases of which 19 are missing R squared 71.9% $= 4.303 Variable Intercept Fertility Coefficient 83.3753 -4.54984 OA. Yes, an outler occurs at approximately x (Round to one decimal place as needed.) ICCO Life Expectancy OB. Yes, an outlier occurs at approximately x= (Round to one decimal place as needed.) OC. No, there is no outlier. c) Interpret the value of R². Choose the correct answer below. 90- 80- 70- 60- 50+ 40- 2 Fersity This outier has an unusually high life expectancy given its fertility rate. b) is there an outlier? If so, identify it. Which data value is unusual? Select the correct choice below and,…arrow_forwardLinear Regression Application, Interpolation and Extrapolation Use the data and story to answer the following questions The table below shows the number of state-registered automatic weapons and the murder rate for several Northwestern states. X 11.4 8.2 y 13.9 6.6 3.6 2.4 2.3 2.3 0.4 11 9.3 6.8 6.3 5.9 6.3 4.3 = thousands of automatic weapons y = murders per 100,000 residents Use your calculator to determine the equation of the regression line. (Round to 2 decimal places) Determine the regression equation in y = ax + b form and write it below. Answer = A) How many murders per 100,000 residents can be expected in a state with 4 thousand automatic weapons? Answer = Round to 3 decimal places. B) How many murders per 100,000 residents can be expected in a state with 11 thousand automatic weapons? Round to 3 decimal places.arrow_forward
- Linear Regression Application, Interpolation and Extrapolation Use the data and story to answer the following questions The table below shows the number of state-registered automatic weapons and the murder rate for several Northwestern states. x 11.3 8.5 6.8 3.5 2.4 2.4 2.4 0.3 y 13.8 11.6 9.7 6.9 6.1 6.1 6 4.1 x = thousands of automatic weapons y = murders per 100,000 residents Use your calculator to determine the equation of the regression line. (Round to 2 decimal places) Determine the regression equation in y = ax + b form and write it below. A) How many murders per 100,000 residents can be expected in a state with 8.3 thousand automatic weapons? Answer = Round to 3 decimal places. B) How many murders per 100,000 residents can be expected in a state with 5.3 thousand automatic weapons? Answer= Round to 3 decimal places.arrow_forward. Determine the regression equation using values you create for x and y for at least 10 pairs of data. Show the regression equation, correlation coefficient, and coefficient of determination. Then switch the x and y values for each data point. Based on that, again show the regression equation, correlation coefficient, and coefficient of determination. Discuss the similarities and differences between the results.arrow_forward14arrow_forward
- A study was done to look at the relationship between number of vacation days employees take each year and the number of sick days they take each year. The results of the survey are shown below. Vacation Days 5 15 13 3 9 0 3 7 7 14 4 Sick Days 5 5 1 5 4 9 9 6 5 3 9 Use the model to predict the number of sick days taken for an employee who took 3 vacation days this year.Sick Days = ? (Please round your answer to the nearest whole number.) Interpret the slope of the regression line in the context of the question: As x goes up, y goes down. The slope has no practical meaning since a negative number cannot occur with vacation days and sick days. For every additional vacation day taken, employees tend to take on average 0.40 fewer sick days. Interpret the y-intercept in the context of the question: The y-intercept has no practical meaning for this study. If an employee takes no vacation days, then that employee will take 8 sick days. The average number of sick days is…arrow_forwardSuppose the correlation between height and weight for adults is +0.80. What proportion of the variability in weight can be explained by the relationship with height? A. 20% B. 36% C. 64% D. 80%arrow_forwardThe table below shows the number of state-registered automatic weapons and the murder rate for several Northwestern states. X Y 11.4 8.6 7.2 3.6 13.5 11.3 10.1 x = thousands of automatic weapons y = murders per 100,000 residents 2.4 2.8 2.3 0.9 7 6.1 6.6 5.9 4.7 This data can be modeled by the equation y = 0.83x +4.06. Use this equation to answer the following; Special Note: I suggest you verify this equation by performing linear regression on your calculator. Answer = A) How many murders per 100,000 residents can be expected in a state with 2.7 thousand automatic weapons? Answer = Round to 3 decimal places. B) How many murders per 100,000 residents can be expected in a state with 11 thousand automatic weapons? Round to 3 decimal places.arrow_forward
arrow_back_ios
SEE MORE QUESTIONS
arrow_forward_ios
Recommended textbooks for you
- MATLAB: An Introduction with ApplicationsStatisticsISBN:9781119256830Author:Amos GilatPublisher:John Wiley & Sons Inc
 Probability and Statistics for Engineering and th...StatisticsISBN:9781305251809Author:Jay L. DevorePublisher:Cengage Learning
 Statistics for The Behavioral Sciences (MindTap C...StatisticsISBN:9781305504912Author:Frederick J Gravetter, Larry B. WallnauPublisher:Cengage Learning
  Elementary Statistics: Picturing the World (7th E...StatisticsISBN:9780134683416Author:Ron Larson, Betsy FarberPublisher:PEARSON
 The Basic Practice of StatisticsStatisticsISBN:9781319042578Author:David S. Moore, William I. Notz, Michael A. FlignerPublisher:W. H. Freeman
 Introduction to the Practice of StatisticsStatisticsISBN:9781319013387Author:David S. Moore, George P. McCabe, Bruce A. CraigPublisher:W. H. Freeman
MATLAB: An Introduction with Applications
Statistics
ISBN:9781119256830
Author:Amos Gilat
Publisher:John Wiley & Sons Inc
Probability and Statistics for Engineering and th...
Statistics
ISBN:9781305251809
Author:Jay L. Devore
Publisher:Cengage Learning
Statistics for The Behavioral Sciences (MindTap C...
Statistics
ISBN:9781305504912
Author:Frederick J Gravetter, Larry B. Wallnau
Publisher:Cengage Learning
Elementary Statistics: Picturing the World (7th E...
Statistics
ISBN:9780134683416
Author:Ron Larson, Betsy Farber
Publisher:PEARSON
The Basic Practice of Statistics
Statistics
ISBN:9781319042578
Author:David S. Moore, William I. Notz, Michael A. Fligner
Publisher:W. H. Freeman
Introduction to the Practice of Statistics
Statistics
ISBN:9781319013387
Author:David S. Moore, George P. McCabe, Bruce A. Craig
Publisher:W. H. Freeman