
MATLAB: An Introduction with Applications
6th Edition
ISBN: 9781119256830
Author: Amos Gilat
Publisher: John Wiley & Sons Inc
expand_more
expand_more
format_list_bulleted
Related questions
Question
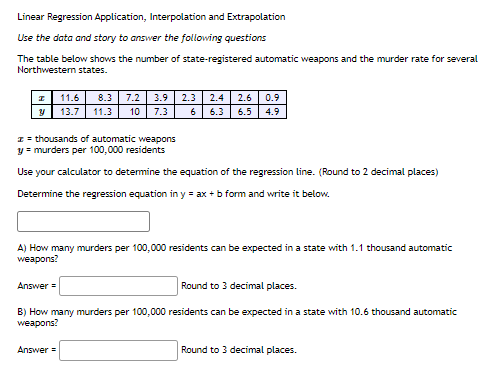

Transcribed Image Text:Linear Regression Application, Interpolation and Extrapolation
Use the data and story to answer the following questions
The table below shows the number of state-registered automatic weapons and the murder rate for several
Northwestern states.
11.6
8.3
7.2
3.9 2.3
2.4
2.6
0.9
13.7
11.3
10
7.3
6
6.3
6.5
4.9
I = thousands of automatic weapons
y = murders per 100,000 residents
Use your calculator to determine the equation of the regression line. (Round to 2 decimal places)
Determine the regression equation in y = ax + b form and write it below.
A) How many murders per 100,000 residents can be expected in a state with 1.1 thousand automatic
weapons?
Answer =
Round to 3 decimal places.
B) How many murders per 100,000 residents can be expected in a state with 10.6 thousand automatic
weapons?
Answer =
Round to 3 decimal places.
Expert Solution
This question has been solved!
Explore an expertly crafted, step-by-step solution for a thorough understanding of key concepts.

This is a popular solution

Trending nowThis is a popular solution!

Step by stepSolved in 4 steps

Knowledge Booster

Similar questions
- Which variable is most likely to be an independent variable? reading test score stress level running speed weight loss forms of therapyarrow_forwardI need the right answer for a and b.arrow_forwardResearchers wondered whether the size of a person's brain was related to the individual's mental capacity. They selected a sample of 5 females and 5 males and measured their MRI image pixel counts and IQ scores. Females Males MRI IQ MRI IG The data is reported to the right. Complete parts (a) through (d) below 139 858,472 140 955,003 935,494 924,059 1.079.550 1,001.121 Click the icon to view the critical values table. 991,305 138 141 857,782 833,868 790,619 133 135 132 141 135 140 AMRI 1,080,000- AIO 145 AIO 145- AMRI 1,080,000 780,000 130 130 780,000 130 780,000 780,000 130 1,080,000 145 1,080,000 MRI 145 MRI (b) Compute the linear correlation coefficient between MRI count and IQ. Are MRI count and IQ linearly related? Select the correct choice below and, if necessary, fill in the answer box to complete your choice. (Round to three decimal places as needed.) A. Yes, MRI count and IQ are linearly related since the linear correlation coefficient is O B. No. MRI count and IQ are not…arrow_forward
- Speak Calculate the mode, mean, and median of the following data: 19, 16, 16, 10, 999, 14, 16, 919, 16, 16, 10, 999, 14, 16, 9 Which measure of center does not work well here?A. MedianB. ModeC. MeanD. All of the abovearrow_forwarduse the OLS approach to estinstimate relationship between maize yields and fertilizer applications given the table below; interpret your results. maize yields; 31, 36, 29, 34, 62, 60, 45, 31, 42, 48 fertilizer; 23, 25, 19, 35, 32, 54, 26, 20, 18, 23arrow_forwardFamily Heights. In Exercises 1–5, use the following heights (in.) The data are matched so that each column consists of heights from the same family. Scatterplot Construct a scatterplot of the father/son heights, then interpret it.arrow_forward
arrow_back_ios
arrow_forward_ios
Recommended textbooks for you
- MATLAB: An Introduction with ApplicationsStatisticsISBN:9781119256830Author:Amos GilatPublisher:John Wiley & Sons Inc
 Probability and Statistics for Engineering and th...StatisticsISBN:9781305251809Author:Jay L. DevorePublisher:Cengage Learning
 Statistics for The Behavioral Sciences (MindTap C...StatisticsISBN:9781305504912Author:Frederick J Gravetter, Larry B. WallnauPublisher:Cengage Learning
  Elementary Statistics: Picturing the World (7th E...StatisticsISBN:9780134683416Author:Ron Larson, Betsy FarberPublisher:PEARSON
 The Basic Practice of StatisticsStatisticsISBN:9781319042578Author:David S. Moore, William I. Notz, Michael A. FlignerPublisher:W. H. Freeman
 Introduction to the Practice of StatisticsStatisticsISBN:9781319013387Author:David S. Moore, George P. McCabe, Bruce A. CraigPublisher:W. H. Freeman
MATLAB: An Introduction with Applications
Statistics
ISBN:9781119256830
Author:Amos Gilat
Publisher:John Wiley & Sons Inc
Probability and Statistics for Engineering and th...
Statistics
ISBN:9781305251809
Author:Jay L. Devore
Publisher:Cengage Learning
Statistics for The Behavioral Sciences (MindTap C...
Statistics
ISBN:9781305504912
Author:Frederick J Gravetter, Larry B. Wallnau
Publisher:Cengage Learning
Elementary Statistics: Picturing the World (7th E...
Statistics
ISBN:9780134683416
Author:Ron Larson, Betsy Farber
Publisher:PEARSON
The Basic Practice of Statistics
Statistics
ISBN:9781319042578
Author:David S. Moore, William I. Notz, Michael A. Fligner
Publisher:W. H. Freeman
Introduction to the Practice of Statistics
Statistics
ISBN:9781319013387
Author:David S. Moore, George P. McCabe, Bruce A. Craig
Publisher:W. H. Freeman