Elements Of Electromagnetics
7th Edition
ISBN: 9780190698614
Author: Sadiku, Matthew N. O.
Publisher: Oxford University Press
expand_more
expand_more
format_list_bulleted
Concept explainers
Question

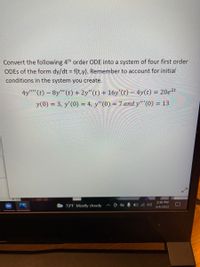
Transcribed Image Text:Convert the following 4th order ODE into a system of four first order
ODES of the form dy/dt f(t,y). Remember to account for initial
conditions in the system you create.
4y"'(t) – 8y"' (t) + 2y"(t) + 16y'(t) – 4y(t) = 20e2t
y(0) = 3, y'(0) = 4, y"(0) = 7 and y"'(0) =
= 13
2:36 PM
73°F Mostly cloudy
3/4/2022
Expert Solution
This question has been solved!
Explore an expertly crafted, step-by-step solution for a thorough understanding of key concepts.
Step by stepSolved in 2 steps with 1 images

Knowledge Booster
Learn more about
Need a deep-dive on the concept behind this application? Look no further. Learn more about this topic, mechanical-engineering and related others by exploring similar questions and additional content below.Similar questions
- Write MATLAB code to perform the following math expression: a) X=7, a=X+2 5 12 2 b) A= 22 L27 4 48 7arrow_forwardHW 2_2 The volume of a partially-filled spherical tank can be computed as: V = πα 3 (3R – d); where d is the depth of the water in the tank (m) and R is the radius of the tank (m). Given that R=3m, to what depth must the tank be filled so that it holds 30 m³? Write a PYTHON code & implement the bisection algorithm to answer the question correct to 3 sig figs. Plot to select your own initial guesses. Display the answer in an informative sentence, using formatted printing.arrow_forwardThis code keeps on generating graphs with different curves. The picture that you see two different graphs comes from the same code but both of them have different curves. I need the curve to look like the picture that only has one graph. I basically need the line to have a slight curve and every time I run the code it will come up as the same graph every time. Use this code on MATLAB and fix it % Sample data for Diesel and Petrol cars carPosition = linspace(1, 60, 50); % Assumed positions of cars % Use the 'seed' function instead of 'rng' seed = 50; % Define your seed here rand('seed',seed); % Assumed CO2 emissions for Diesel and Petrol CO2Diesel = 25 + 5*cos(carPosition/60*2*pi) + randn(1, 50)*5; % Random data for Diesel CO2Petrol = 20 + 5*sin(carPosition/60*2*pi) + randn(1, 50)*5; % Random data for Petrol % Fit polynomial curves with a reduced degree of 2 pDiesel = polyfit(carPosition, CO2Diesel, 2); pPetrol = polyfit(carPosition, CO2Petrol, 2); % Generate points for best fit…arrow_forward
- Engr 215 Matlab Fahrenheit to Celsius using multiple statements Given a Fahrenheit value temperatureFahrenheit, write a statement that assigns temperatureCelsius with the equivalent Celsius value. While the equation is C = 5/9 * (F - 32), as an exercise use two statements, the first of which is "fractionalMultiplier = 5/9;"]arrow_forward6arrow_forwardHello I'm having trouble with this assignment, I don't understand how the plot function works for ordered pairs. I undertand that the points of the line would be the origin(0,0) and (x = cos(theta) . y = sin(theta)).arrow_forward
- For the following concentration expressions, indicate whether they are uniform or nonuniform and in how many dimensions (OD, 1D, 2D, or 3D), and steady or unsteady. Then for the following control volume and origin, and table of constants, use Excel or Matlab to graph profiles that show how concentration changes within the control volume and over time to a limit of 20 for the following: C(x,0,0,0), C(0,y,0,0), c(0,0,z,0) and C(0,0,0,t). On each graph, show which parameters are held constant, the CV boundaries, and the point where all four plots overlap. 20 C(x=0) 10 a 0.0001 b 0.001 20 0.01 y k 0.1 100 All of the following functions are C(space, time) and so not necessarily just x as suggested. a. C,(x)= C,(x = 0)x exp{- ax} d. C, (x) = C, (x = 0)x exp{-ax}x exp{- by² }x exp{-cz²}x exp{- kt}arrow_forwardPlease show all work for c,& d as I cannot solve it for the life of myself A high-altitude skydiver of mass 100kg jumps from an altitude of 25km. Assume a near-standardatmosphere, with the following properties: d) Produce computer-generated plots of the following four quantities experienced by the sky-diver: altitude, temperature, speed, and temperature rate of change (dT /dt|skydiver). Puttime on the horizontal axis for all plots. Use code if possible, I really need help on this, so the sooner I can be leant a hand the betterarrow_forwardI wanted to know how to create plots like these in MATLAB. I belive they were called herpolhode plots.arrow_forward
arrow_back_ios
arrow_forward_ios
Recommended textbooks for you
 Elements Of ElectromagneticsMechanical EngineeringISBN:9780190698614Author:Sadiku, Matthew N. O.Publisher:Oxford University Press
 Mechanics of Materials (10th Edition)Mechanical EngineeringISBN:9780134319650Author:Russell C. HibbelerPublisher:PEARSON
 Thermodynamics: An Engineering ApproachMechanical EngineeringISBN:9781259822674Author:Yunus A. Cengel Dr., Michael A. BolesPublisher:McGraw-Hill Education
 Control Systems EngineeringMechanical EngineeringISBN:9781118170519Author:Norman S. NisePublisher:WILEY
 Mechanics of Materials (MindTap Course List)Mechanical EngineeringISBN:9781337093347Author:Barry J. Goodno, James M. GerePublisher:Cengage Learning
 Engineering Mechanics: StaticsMechanical EngineeringISBN:9781118807330Author:James L. Meriam, L. G. Kraige, J. N. BoltonPublisher:WILEY

Elements Of Electromagnetics
Mechanical Engineering
ISBN:9780190698614
Author:Sadiku, Matthew N. O.
Publisher:Oxford University Press

Mechanics of Materials (10th Edition)
Mechanical Engineering
ISBN:9780134319650
Author:Russell C. Hibbeler
Publisher:PEARSON

Thermodynamics: An Engineering Approach
Mechanical Engineering
ISBN:9781259822674
Author:Yunus A. Cengel Dr., Michael A. Boles
Publisher:McGraw-Hill Education

Control Systems Engineering
Mechanical Engineering
ISBN:9781118170519
Author:Norman S. Nise
Publisher:WILEY

Mechanics of Materials (MindTap Course List)
Mechanical Engineering
ISBN:9781337093347
Author:Barry J. Goodno, James M. Gere
Publisher:Cengage Learning

Engineering Mechanics: Statics
Mechanical Engineering
ISBN:9781118807330
Author:James L. Meriam, L. G. Kraige, J. N. Bolton
Publisher:WILEY