MATLAB: An Introduction with Applications
6th Edition
ISBN: 9781119256830
Author: Amos Gilat
Publisher: John Wiley & Sons Inc
expand_more
expand_more
format_list_bulleted
Topic Video
Question
thumb_up100%

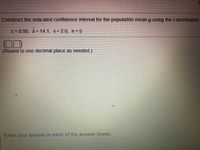
Transcribed Image Text:Construct the indicated confidence interval for the populatión mean u using the t-distribution
C=0.95, x= 14.1, S= 2.0, n=5
(Round to one decimal place as needed.)
Enter your answer in each of the answer boxes
Expert Solution
This question has been solved!
Explore an expertly crafted, step-by-step solution for a thorough understanding of key concepts.
This is a popular solution
Trending nowThis is a popular solution!
Step by stepSolved in 2 steps

Knowledge Booster
Learn more about
Need a deep-dive on the concept behind this application? Look no further. Learn more about this topic, statistics and related others by exploring similar questions and additional content below.Similar questions
- #4data: 0.06, 0.11, 0.16, 0.15, 0.14, 0.08, 0.15. Use the sample data from #4 to construct a 98% confidence interval estimate for the standard deviation of the amount nitrogen-oxide emission for all cars.arrow_forwardThe distribution of study times for first-year students follow a Normal distribution with a standard deviation σ = 48 minutes. Suppose a sample of 344 students found that the mean study time for these students was x¯= 170 minutes per week. Use this to find a 94.38% confidence interval to estimate the mean study time for all students. We are 94.38% confident that the mean study time for first-year students is between the following ( answer) minutes and ( answer) minutes. The answer needs to be the mean study time for first-year students is between what amount of minutes and the following minutes.arrow_forwardThe standard deviation, S, for the annual medical cost of 24 households was found to equal $1689 find a 95% confidence interval for the standard deviation of the annual medical cost for all households. Assume medical costs are normally distributed.arrow_forward
- From a sample of 36 graduate students, the mean number of months of work experience prior to entering an MBA program was 33.39. The national standard deviation is known to be 19 months. What is a 95% confidence interval for the population mean? A 95% confidence interval for the population mean is (Use ascending order. Round to two decimal places as needed.)arrow_forwardThe mayor is interested in finding a 90% confidence interval for the mean number of pounds of trash per person per week that is generated in the city. The study included 212 residents whose mean number of pounds of trash generated per person per week was 37.9 pounds and the standard deviation was 7.7 pounds. Round answers to 3 decimal places where possible. b. With 90% confidence the population mean number of pounds per person per week is between _______ and ________ pounds. c. If many groups of 212 randomly selected members are studied, then a different confidence interval would be produced from each group. About __________ percent of these confidence intervals will contain the true population mean number of pounds of trash generated per person per week and about ____________ percent will not contain the true population mean number of pounds of trash generated per person per week.arrow_forwardSuppose the population standard deviation is = 5, an SRS of n = 100 is obtained, and the confidence level is chosen to be 99.5%. The margin of error for estimating a mean is given by: a. 1.576. b. 1.165. c. 1.404. d. 1.223.arrow_forward
- The manager of a fleet of automobiles is testing two brands of radial tires and assigns one tire of each brand at random to the two rear wheels of eight cars and runs the cars until the tires wear out. The data (in kilometers) follow. Find a 99% confidence interval on the difference in the mean life. Car Brand 1 Brand 2 1 36,925 34,318 2 45,300 42,280 3 36,256 35.548 4 32,100 31,950 5 37,210 38,015 6 48,360 47,800 7 38.200 37,810 8 33,500 33,215 Round your answer to 2 decimal places. Do not use commas.arrow_forwardIt is not taking (0.1404, 0.3596) as the confidence intervalarrow_forward
arrow_back_ios
arrow_forward_ios
Recommended textbooks for you
 MATLAB: An Introduction with ApplicationsStatisticsISBN:9781119256830Author:Amos GilatPublisher:John Wiley & Sons Inc
 Probability and Statistics for Engineering and th...StatisticsISBN:9781305251809Author:Jay L. DevorePublisher:Cengage Learning
 Statistics for The Behavioral Sciences (MindTap C...StatisticsISBN:9781305504912Author:Frederick J Gravetter, Larry B. WallnauPublisher:Cengage Learning
 Elementary Statistics: Picturing the World (7th E...StatisticsISBN:9780134683416Author:Ron Larson, Betsy FarberPublisher:PEARSON
 The Basic Practice of StatisticsStatisticsISBN:9781319042578Author:David S. Moore, William I. Notz, Michael A. FlignerPublisher:W. H. Freeman
 Introduction to the Practice of StatisticsStatisticsISBN:9781319013387Author:David S. Moore, George P. McCabe, Bruce A. CraigPublisher:W. H. Freeman

MATLAB: An Introduction with Applications
Statistics
ISBN:9781119256830
Author:Amos Gilat
Publisher:John Wiley & Sons Inc

Probability and Statistics for Engineering and th...
Statistics
ISBN:9781305251809
Author:Jay L. Devore
Publisher:Cengage Learning

Statistics for The Behavioral Sciences (MindTap C...
Statistics
ISBN:9781305504912
Author:Frederick J Gravetter, Larry B. Wallnau
Publisher:Cengage Learning

Elementary Statistics: Picturing the World (7th E...
Statistics
ISBN:9780134683416
Author:Ron Larson, Betsy Farber
Publisher:PEARSON

The Basic Practice of Statistics
Statistics
ISBN:9781319042578
Author:David S. Moore, William I. Notz, Michael A. Fligner
Publisher:W. H. Freeman

Introduction to the Practice of Statistics
Statistics
ISBN:9781319013387
Author:David S. Moore, George P. McCabe, Bruce A. Craig
Publisher:W. H. Freeman