MATLAB: An Introduction with Applications
6th Edition
ISBN: 9781119256830
Author: Amos Gilat
Publisher: John Wiley & Sons Inc
expand_more
expand_more
format_list_bulleted
Question

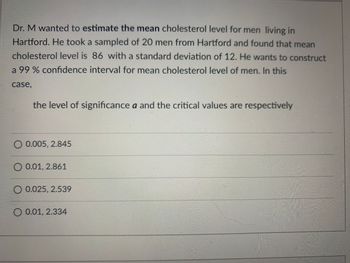
Transcribed Image Text:Dr. M wanted to estimate the mean cholesterol level for men living in
Hartford. He took a sampled of 20 men from Hartford and found that mean
cholesterol level is 86 with a standard deviation of 12. He wants to construct
a 99% confidence interval for mean cholesterol level of men. In this
case,
the level of significance a and the critical values are respectively
O 0.005, 2.845
0.01, 2.861
0.025, 2.539
O 0.01, 2.334
Expert Solution
This question has been solved!
Explore an expertly crafted, step-by-step solution for a thorough understanding of key concepts.
This is a popular solution
Trending nowThis is a popular solution!
Step by stepSolved in 3 steps with 1 images

Knowledge Booster
Similar questions
- How can we also find normality?arrow_forwardMrs. Gallas wanted to estimate the average weight of an Oreo cookie to determine if theaverage weight was less than advertised. She selected a random sample of 30 cookies andfound the weight of each cookie (in grams). The mean weight was = 11.1921 grams with astandard deviation of sx = 0.0817 grams. Make a 95% confidence interval to estimate the truemean weight of an Oreo. 1. What is the formula for calculating the standard deviation of the sampling distribution of x? 2.What condition must be met to use this formula? Has it been met?arrow_forwardThe average American consumes 97 liters of alcohol per year. Does the average college student consume a different amount of alcohol per year? A researcher surveyed 12 randomly selected college students and found that they averaged 79.1 liters of alcohol consumed per year with a standard deviation of 19 liters. What can be concluded at the the a = 0.05 level of significance? a. For this study, we should use Select an answer b. The null and alternative hypotheses would be: Ho: ? Select an answer H₁: ? Select an answer ✓ c. The test statistic ? v = (please show your answer to 3 decimal places.) (Please show your answer to 4 decimal places.) d. The p-value =arrow_forward
- Karen wants to advertise how many chocolate chips are in each Big Chip cookie at her bakery. She randomly selects a sample of 44 cookies and finds that the number of chocolate chips per cookie in the sample has a mean of 5.1 and a standard deviation of 3.5. What is the 80% confidence interval for the number of chocolate chips per cookie for Big Chip cookies? Enter your answers accurate to one decimal place (because the sample statistics are reported accurate to one decimal place). |<µ<arrow_forwardUse z scores to compare the given values. The tallest living man at one time had a height of 238 cm. The shortest living man at that time had a height of 142.4 cm. Heights of men at that time had a mean of 175.45 cm and a standard deviation of 5.59 cm. Which of these two men had the height that was more extreme? ... Since the z score for the tallest man is z = 0 and the z score for the shortest man is z = the man had the height that was Im- more extreme. (Round to two decimal places.) shortest tallestarrow_forwardSam is the manager of a used clothing store. He wants to estimate the average amount a customer spends per visit. A random sample of 70 customers’ receipts gave a mean of = $7.10 with a standard deviation s = $2.30. Find a 99% confidence interval for the average amount spent by all customers. Interpret your findings.arrow_forward
- A survey of 30 adults found that the mean age of a person's vehicle is 3.6 years. Assuming the population distribution is normal and the standard deviation is 2 years, find the 94% confidence interval for the population mean. What is the meaning of this confidence interval?arrow_forwardKaren wants to advertise how many chocolate chips are in each Big Chip cookie at her bakery. She randomly selects a sample of 52 cookies and finds that the number of chocolate chips per cookie in the sample has a mean of 6.7 and a standard deviation of 2.4. What is the 90% confidence interval for the number of chocolate chips per cookie for Big Chip cookies? Enter your answers accurate to one decimal place (because the sample statistics are reported accurate to one decimal place). _____< μ < _____arrow_forwardI have a question: You are interested in estimating the the mean weight of the local adult population of female white-tailed deer (doe). From past data, you estimate that the standard deviation of all adult female white-tailed deer in this region to be 21 pounds. What sample size would you need to in order to estimate the mean weight of all female white-tailed deer, with a 94% confidence level, to within 4 pounds of the actual weight?arrow_forward
arrow_back_ios
arrow_forward_ios
Recommended textbooks for you
 MATLAB: An Introduction with ApplicationsStatisticsISBN:9781119256830Author:Amos GilatPublisher:John Wiley & Sons Inc
 Probability and Statistics for Engineering and th...StatisticsISBN:9781305251809Author:Jay L. DevorePublisher:Cengage Learning
 Statistics for The Behavioral Sciences (MindTap C...StatisticsISBN:9781305504912Author:Frederick J Gravetter, Larry B. WallnauPublisher:Cengage Learning
 Elementary Statistics: Picturing the World (7th E...StatisticsISBN:9780134683416Author:Ron Larson, Betsy FarberPublisher:PEARSON
 The Basic Practice of StatisticsStatisticsISBN:9781319042578Author:David S. Moore, William I. Notz, Michael A. FlignerPublisher:W. H. Freeman
 Introduction to the Practice of StatisticsStatisticsISBN:9781319013387Author:David S. Moore, George P. McCabe, Bruce A. CraigPublisher:W. H. Freeman

MATLAB: An Introduction with Applications
Statistics
ISBN:9781119256830
Author:Amos Gilat
Publisher:John Wiley & Sons Inc

Probability and Statistics for Engineering and th...
Statistics
ISBN:9781305251809
Author:Jay L. Devore
Publisher:Cengage Learning

Statistics for The Behavioral Sciences (MindTap C...
Statistics
ISBN:9781305504912
Author:Frederick J Gravetter, Larry B. Wallnau
Publisher:Cengage Learning

Elementary Statistics: Picturing the World (7th E...
Statistics
ISBN:9780134683416
Author:Ron Larson, Betsy Farber
Publisher:PEARSON

The Basic Practice of Statistics
Statistics
ISBN:9781319042578
Author:David S. Moore, William I. Notz, Michael A. Fligner
Publisher:W. H. Freeman

Introduction to the Practice of Statistics
Statistics
ISBN:9781319013387
Author:David S. Moore, George P. McCabe, Bruce A. Craig
Publisher:W. H. Freeman