
MATLAB: An Introduction with Applications
6th Edition
ISBN: 9781119256830
Author: Amos Gilat
Publisher: John Wiley & Sons Inc
expand_more
expand_more
format_list_bulleted
Related questions
Question
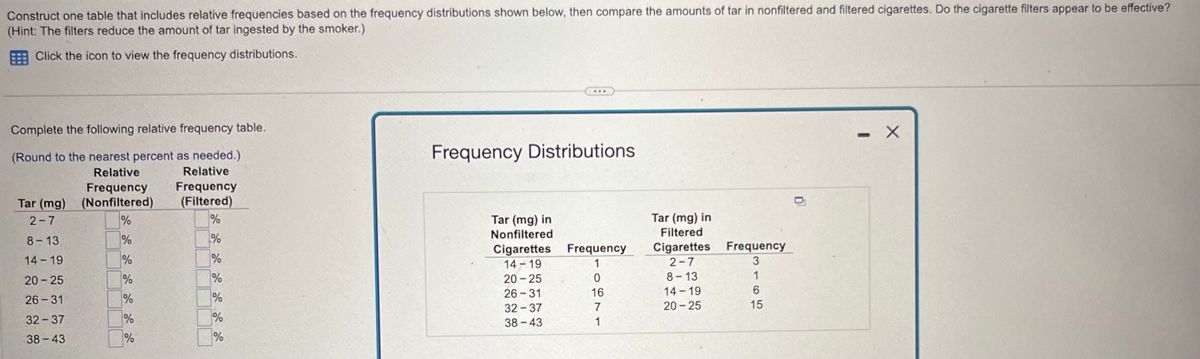

Transcribed Image Text:Construct one table that includes relative frequencies based on the frequency distributions shown below, then compare the amounts of tar in nonfiltered and filtered cigarettes. Do the cigarette filters appear to be effective?
(Hint: The filters reduce the amount of tar ingested by the smoker.)
Click the icon to view the frequency distributions.
Complete the following relative frequency table.
(Round to the nearest percent as needed.)
Frequency Distributions
D
Relative
Frequency
Relative
Frequency
Tar (mg)
(Nonfiltered)
(Filtered)
2-7
%
%
Tar (mg) in
Nonfiltered
Tar (mg) in
Filtered
8-13
%
%
Cigarettes
Frequency
Cigarettes
Frequency
14-19
%
%
14-19
1
2-7
3
20-25
%
%
20-25
0
8-13
1
26-31
16
14-19
6
26-31
%
%
32-37
7
20-25
15
32-37
%
%
38-43
1
38-43
%
%
-
SAVE
AI-Generated Solution
info
AI-generated content may present inaccurate or offensive content that does not represent bartleby’s views.
Unlock instant AI solutions
Tap the button
to generate a solution
to generate a solution
Click the button to generate
a solution
a solution
Knowledge Booster

Similar questions
- #1arrow_forwardThe frequency distribution below explains a group of college student’s approximate monthly expenses. Use the data to calculate the proportion and percent of each expenses. (round proportion to the nearest thousandths and percent to nearest tenth topping frequency proportions precent rent 500 clothes 150 commute 125 food 250 miscellaneous 75arrow_forwardFind the mean of the data from the frequency table: Value Frequency 0 6 1 0 2 6 3 8 4 9 5 6 Give your answer to two decimal places.arrow_forward
- A biologist exposed a certain type of bacteria to gamma radiation to see how long they would live. He gathered data on the survival time of a number of bacterial cells and organized the data into the histogram below. Use the histogram to construct a frequency table. (The relative frequencies should be in decimal form.) 60+ 50 40 30 10 440 282 Survival Time (in Seconds) 45 124 203 361 519 Survival Time of Bacteria upon Exposure to Gamma Radiation Frequency Survival Time (in Seconds) Relative Frequency 45-124 124-203 203-282 282-361 361-440 440-519 Frequency 20arrow_forwardA frequency table of grades has five classes (A, B, C, D, F) with frequencies of 5, 13, 16, 4, and 3 o respectively. Using percentages, what are the relative frequencies of the five classes? Complete the table. Grade Frequency Relative frequency. A % 13 % 16 4. F. (Round to two decimal places as needed.) BCDarrow_forwardRichard’s doctor had told him he needed to keep track of his blood sugar readings. Listed below are his 20 latest readings. He wanted to create a visual aid for himself in order to see how his blood sugar was doing. 75 125 110 82 178 209 150 130 120 142 90 98 107 163 135 129 147 152 110 100 A. Create a frequency distribution table for the given data set. B. Create a histogram for the data set. C. Describe the distribution of the data.arrow_forward
- A frequency table of grades has five classes (A, B, C, D, F) with frequencies of 2, 15, 18, 4, and 2 respectively. Using percentages, what are the relative frequencies of the five classes? Complete the table. Grade Frequency Relative frequency A 2 % B 15 % 18 D 4 % F 2 % (Round to two decimal places as needed.)arrow_forwardBack up your data: In a survey backed up their computer's hard drive. The following frequency distribution presents the results. mmissioned by an electronics company, U.S. computer users wereasked how often they Response More than once per month Frequency 844 Once every 1-3 months 521 Once every 4-6 months 229 Once every 7-11 months Once per year or less Neverarrow_forwardFinish times (to the nearest hour) for 10 dogsled teams are shown below. Make a frequency table showing class limits, class boundaries, midpoints, frequency, relative frequencies, and cumulative frequencies. Use three classes. (Round your answer for relative frequency to the nearest hundredth and for midpoint to the nearest tenth.) 308 262 310 268 299 249 257 286 239 278arrow_forward
arrow_back_ios
arrow_forward_ios
Recommended textbooks for you
- MATLAB: An Introduction with ApplicationsStatisticsISBN:9781119256830Author:Amos GilatPublisher:John Wiley & Sons Inc
 Probability and Statistics for Engineering and th...StatisticsISBN:9781305251809Author:Jay L. DevorePublisher:Cengage Learning
 Statistics for The Behavioral Sciences (MindTap C...StatisticsISBN:9781305504912Author:Frederick J Gravetter, Larry B. WallnauPublisher:Cengage Learning
  Elementary Statistics: Picturing the World (7th E...StatisticsISBN:9780134683416Author:Ron Larson, Betsy FarberPublisher:PEARSON
 The Basic Practice of StatisticsStatisticsISBN:9781319042578Author:David S. Moore, William I. Notz, Michael A. FlignerPublisher:W. H. Freeman
 Introduction to the Practice of StatisticsStatisticsISBN:9781319013387Author:David S. Moore, George P. McCabe, Bruce A. CraigPublisher:W. H. Freeman
MATLAB: An Introduction with Applications
Statistics
ISBN:9781119256830
Author:Amos Gilat
Publisher:John Wiley & Sons Inc
Probability and Statistics for Engineering and th...
Statistics
ISBN:9781305251809
Author:Jay L. Devore
Publisher:Cengage Learning
Statistics for The Behavioral Sciences (MindTap C...
Statistics
ISBN:9781305504912
Author:Frederick J Gravetter, Larry B. Wallnau
Publisher:Cengage Learning
Elementary Statistics: Picturing the World (7th E...
Statistics
ISBN:9780134683416
Author:Ron Larson, Betsy Farber
Publisher:PEARSON
The Basic Practice of Statistics
Statistics
ISBN:9781319042578
Author:David S. Moore, William I. Notz, Michael A. Fligner
Publisher:W. H. Freeman
Introduction to the Practice of Statistics
Statistics
ISBN:9781319013387
Author:David S. Moore, George P. McCabe, Bruce A. Craig
Publisher:W. H. Freeman