
MATLAB: An Introduction with Applications
6th Edition
ISBN: 9781119256830
Author: Amos Gilat
Publisher: John Wiley & Sons Inc
expand_more
expand_more
format_list_bulleted
Related questions
Concept explainers
Topic Video
Question
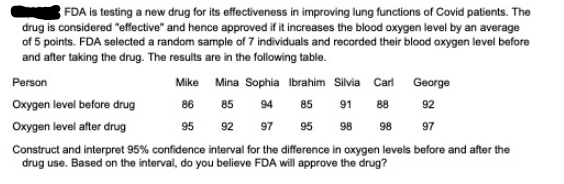

Transcribed Image Text:FDA is testing a new drug for its effectiveness in improving lung functions of Covid patients. The
drug is considered "effective" and hence approved if it increases the blood oxygen level by an average
of 5 points. FDA selected a random sample of 7 individuals and recorded their blood oxygen level before
and after taking the drug. The results are in the following table.
Person
Mike Mina Sophia Ibrahim Silvia Carl George
Oxygen level before drug
86
85
94
85
91
88
92
Oxygen level after drug
95
92
97
95
98
98
97
Construct and interpret 95% confidence interval for the difference in oxygen levels before and after the
drug use. Based on the interval, do you believe FDA will approve the drug?
Expert Solution
This question has been solved!
Explore an expertly crafted, step-by-step solution for a thorough understanding of key concepts.

Step by stepSolved in 2 steps with 2 images

Knowledge Booster


Learn more about
Need a deep-dive on the concept behind this application? Look no further. Learn more about this topic, statistics and related others by exploring similar questions and additional content below.Similar questions
- I'm stuck on part 2. Can you work the problem and explain how to get the answer to part B? If it can be put into the calculator, I can't remember the process. Please explain. Thank you. Translate the statement into a confidence interval. Approximate the level of confidence. In a survey of 1100 adults in a country, 68% think teaching is one of the most important jobs in the country today. The survey's margin of error is ±4%. Question content area bottom Part 1 The confidence interval for the proportion is . 64.64,. 72.72. (Round to three decimal places as needed.) Part 2 The interval is a enter your response here% confidence interval. (Round to one decimal place as needed.)arrow_forwardc=99 o= 3 n= 11 what is 99% confidence interval?arrow_forwardIdentify the t-score for a 95% confidence interval if the sample size is 15. t = the answer isnt 2.131 so what is the answer?arrow_forward
- Construct a 96% confidence interval if x=75 and n=200. Round your answers to 3 decimal places.arrow_forwardSee the graph of data below to answer the following question Obtain a 95% confidence interval for the difference between the mean rates of return. Interpret the interval.arrow_forwardIn a sample of 500 Canadians, it was found that 400 people preferred apple products. In a sample of 700 Americans it was found that 600 preferred apple products. Is the proportion Canadians who prefer apple products less than Americans. 1. Construct 95% confidence interval for difference of proportions. 2. From the confidence interval, do you think that the proportion of Canadians who prefer apple products is different from Americans.arrow_forward
- You measure 31 backpacks' weights, and find they have a mean weight of 79 ounces. Assume the population standard deviation is 3.8 ounces. Based on this, construct a 95% confidence interval for the true population mean backpack weight.arrow_forwardIf n = 110 and X = 88, construct a 99% confidence interval for the population proportion, p.Give your answers to three decimals < p <arrow_forwardFind the critical value for a 98% confidence interval. Then calculate the interval.arrow_forward
arrow_back_ios
arrow_forward_ios
Recommended textbooks for you
- MATLAB: An Introduction with ApplicationsStatisticsISBN:9781119256830Author:Amos GilatPublisher:John Wiley & Sons Inc
 Probability and Statistics for Engineering and th...StatisticsISBN:9781305251809Author:Jay L. DevorePublisher:Cengage Learning
 Statistics for The Behavioral Sciences (MindTap C...StatisticsISBN:9781305504912Author:Frederick J Gravetter, Larry B. WallnauPublisher:Cengage Learning
  Elementary Statistics: Picturing the World (7th E...StatisticsISBN:9780134683416Author:Ron Larson, Betsy FarberPublisher:PEARSON
 The Basic Practice of StatisticsStatisticsISBN:9781319042578Author:David S. Moore, William I. Notz, Michael A. FlignerPublisher:W. H. Freeman
 Introduction to the Practice of StatisticsStatisticsISBN:9781319013387Author:David S. Moore, George P. McCabe, Bruce A. CraigPublisher:W. H. Freeman
MATLAB: An Introduction with Applications
Statistics
ISBN:9781119256830
Author:Amos Gilat
Publisher:John Wiley & Sons Inc
Probability and Statistics for Engineering and th...
Statistics
ISBN:9781305251809
Author:Jay L. Devore
Publisher:Cengage Learning
Statistics for The Behavioral Sciences (MindTap C...
Statistics
ISBN:9781305504912
Author:Frederick J Gravetter, Larry B. Wallnau
Publisher:Cengage Learning
Elementary Statistics: Picturing the World (7th E...
Statistics
ISBN:9780134683416
Author:Ron Larson, Betsy Farber
Publisher:PEARSON
The Basic Practice of Statistics
Statistics
ISBN:9781319042578
Author:David S. Moore, William I. Notz, Michael A. Fligner
Publisher:W. H. Freeman
Introduction to the Practice of Statistics
Statistics
ISBN:9781319013387
Author:David S. Moore, George P. McCabe, Bruce A. Craig
Publisher:W. H. Freeman