
MATLAB: An Introduction with Applications
6th Edition
ISBN: 9781119256830
Author: Amos Gilat
Publisher: John Wiley & Sons Inc
expand_more
expand_more
format_list_bulleted
Related questions
Question
Construct a 99% confidence interval to estimate the population proportion with a sample portion equal to 0.90 and the sample size equal to 450.
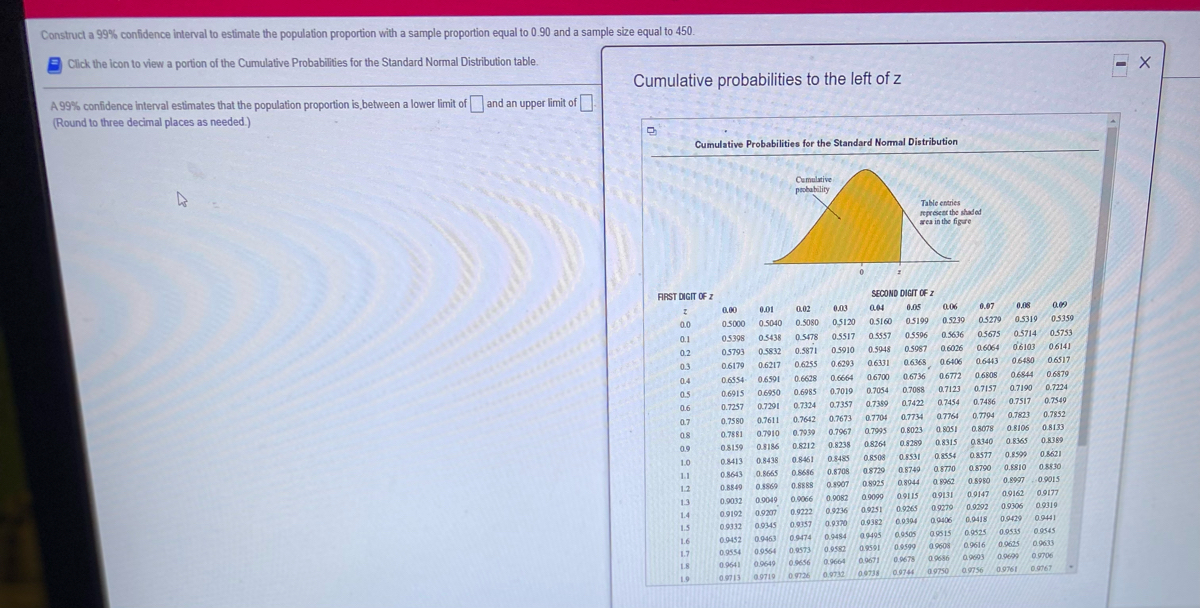

Transcribed Image Text:Construct a 99% confidence interval to estimate the population proportion with a sample proportion equal to 0.90 and a sample size equal to 450.
Click the icon to view a portion of the Cumulative Probabilities for the Standard Normal Distribution table.
Cumulative probabilities to the left of z
A 99% confidence Interval estimates that the population proportion is,between a lower limit of and an upper limit of
(Round to three decimal places as needed.)
Cumulative Probabilities for the Standard Normal Distribution
Cumulative
pobability
Table entries
Rprset the shadad
arca in the figure
SECOND DIGIT OF z
FIRST DIGIT OF Z
0.01
0.03
0.04
0.05
0.06
0.07
0.08
0.09
0.00
0.02
05000
0.5040
0.5080
0,5120
0.5160
05199
0.5239
05279
0.319
05359
0.0
0.5636
0.5714
05753
0.1
05398
05438
0.5478
05517
0.5557
0.5596
05675
0.5832
0.5871
0.5948
0.5987
0.6026
0.6064
06103
06141
0.5910
0.2
05793
0.6293
0.6368
06406
0.6443
06480
06517
03
06179
0.6217
0.6255
0.6331
0.6554
06591
0.6628
0.6664
0.6700
0.6736
0.6772
0.6808
06844
0.6879
04
0.7123
0.7157
0.7190
0.7224
0.
0.6915
0.6950
0.6985
0.7019
0.7054
0.7088
0.7324 0.7357
0.7422
0.7454
0.7486
0.7517
0.7549
0.7389
0.6
0.7257
0.7291
0.7642
0.7673
0.7704
0.7734
0.7764
0.7794
0.7823
0.7852
07
0.7580
0.7611
0.8023
0.8051
0.8078
0,8106
0.8133
08
0.7881
0.7910
0.7939
0.7967
0.7995
0.8238
0.8264
0.8289
0.8315
08340
0.865
0.8389
08159
0.8186
0.8212
09
0.8485
0.8508
0.8531
0.8554
0.8577
0.8599
0.8621
LO
0.8413
0.8438
0.8461
0.8708
0.8729
0.8749
08770
0.8790
0.8810
08830
11
08643
0.8665
0.8686
0.8907
0.8925
0.8944
0.8962
0.8980
0.8997
0.9015
1.2
O.8840
0.s869
0.8888
0.0066
0.9082
0.9099
0911S
09131
0.9147
0.9162
09177
13
0.9032
0.9049
0.9292
0.9319
0.9222
0.9236
0.9251
0.9265
09279
0.9306
1.4
0.9192
0.9207
0.9382
0.0394
0.9406
0,0418
0.9429
0.9441
0.9332
0.0345
0.9357
0.9370
1.5
0.9484
0.9495
0.9505
0.9515
0.9525
0.9515
0.9545
0.9474
0.9452
0.9554
16
0.9463
0.9608
0.9616
0.9625
0.9633
0.9564
0.9573
0.9582
0.9591
0.9599
17
99603
0.9706
0.0671
0.9678
0.9686
0.9699
L8
0.9641
0.9649
0.9656
0.9664
0.0738
0.9750
09756
0.9761
0.0767
0.0744
0.9713 09719
0.9732
19
Expert Solution
This question has been solved!
Explore an expertly crafted, step-by-step solution for a thorough understanding of key concepts.

This is a popular solution

Trending nowThis is a popular solution!

Step by stepSolved in 2 steps with 2 images

Knowledge Booster

Similar questions
- Does the confidence interval not change for population proportion vs sample proportionarrow_forwardThe average weight of 31 randomly selected minivans was 4150 pounds. The sample standard deviation was 480 pounds. Find the 99 percent confidence interval of the true population mean weight of minivans.arrow_forwardWhat is the minimum required sample size to make a 96% confidence interval for a population mean if the margin of error is to be 2 inches and the standard deviation is thought to be about 12 inches?arrow_forward
- Suppose a 90 percent confidence interval to estimate a population proportion was calculated from a sample proportion of 18 percent and a margin of error of 4 percent. What is the width of the confidence interval?arrow_forwardA research doctor wanted to estimate the average total cholesterol level of general adult population. He took a random sample of 12 adults for blood test and obtained the following sample. Assume that total cholesterol level of adult population is normally distributed. Use these data to create a 95% confidence interval for the population mean total cholesterol level. 175, 234, 189, 256, 170, 187, 192, 225, 245, 251, 195, 230 a) Find the sample mean and the standard deviation (round to two decimal places) b) 95% confidence interval for the population mean total cholesterol level (round to two decimal places)arrow_forwardThe National Center for Education Statistics surveyed 4400 college graduates about the lengths of time required to earn their bachelor's degrees. The mean is 5.15 years, and the standard deviation is 1.68 years. Based enthuse sample data, construct the 99% confidence interval for the mean time required by all college graduates. left left: right:arrow_forward
- Estimate the minimum sample size needed to achieve the margin of error E= 0.026 for a 95% confidence interval.arrow_forwardSuppose we know that a confidence interval for a population proportion is (0.105,0.355), with a sample proportion of p̂=0.23. What is the margin of error?arrow_forwardWhat is the approximate sample size required to estimate the percentage of Americans who have earned a college degree to within 2%, with 95% confidence?arrow_forward
arrow_back_ios
arrow_forward_ios
Recommended textbooks for you
- MATLAB: An Introduction with ApplicationsStatisticsISBN:9781119256830Author:Amos GilatPublisher:John Wiley & Sons Inc
 Probability and Statistics for Engineering and th...StatisticsISBN:9781305251809Author:Jay L. DevorePublisher:Cengage Learning
 Statistics for The Behavioral Sciences (MindTap C...StatisticsISBN:9781305504912Author:Frederick J Gravetter, Larry B. WallnauPublisher:Cengage Learning
  Elementary Statistics: Picturing the World (7th E...StatisticsISBN:9780134683416Author:Ron Larson, Betsy FarberPublisher:PEARSON
 The Basic Practice of StatisticsStatisticsISBN:9781319042578Author:David S. Moore, William I. Notz, Michael A. FlignerPublisher:W. H. Freeman
 Introduction to the Practice of StatisticsStatisticsISBN:9781319013387Author:David S. Moore, George P. McCabe, Bruce A. CraigPublisher:W. H. Freeman
MATLAB: An Introduction with Applications
Statistics
ISBN:9781119256830
Author:Amos Gilat
Publisher:John Wiley & Sons Inc
Probability and Statistics for Engineering and th...
Statistics
ISBN:9781305251809
Author:Jay L. Devore
Publisher:Cengage Learning
Statistics for The Behavioral Sciences (MindTap C...
Statistics
ISBN:9781305504912
Author:Frederick J Gravetter, Larry B. Wallnau
Publisher:Cengage Learning
Elementary Statistics: Picturing the World (7th E...
Statistics
ISBN:9780134683416
Author:Ron Larson, Betsy Farber
Publisher:PEARSON
The Basic Practice of Statistics
Statistics
ISBN:9781319042578
Author:David S. Moore, William I. Notz, Michael A. Fligner
Publisher:W. H. Freeman
Introduction to the Practice of Statistics
Statistics
ISBN:9781319013387
Author:David S. Moore, George P. McCabe, Bruce A. Craig
Publisher:W. H. Freeman