
MATLAB: An Introduction with Applications
6th Edition
ISBN: 9781119256830
Author: Amos Gilat
Publisher: John Wiley & Sons Inc
expand_more
expand_more
format_list_bulleted
Related questions
Question
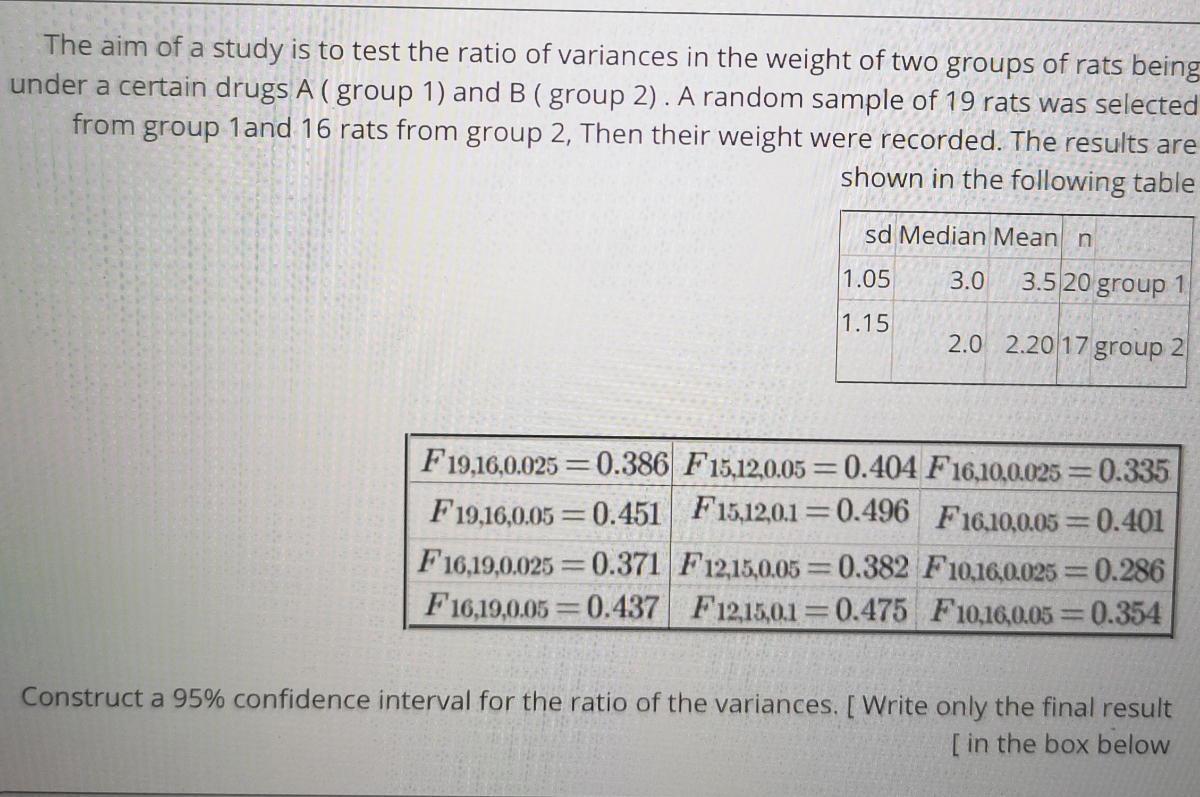

Transcribed Image Text:The aim of a study is to test the ratio of variances in the weight of two groups of rats being
under a certain drugs A ( group 1) and B ( group 2) . A random sample of 19 rats was selected
from group land 16 rats from group 2, Then their weight were recorded. The results are
shown in the following table
sd Median Mean n
1.05
3.0
3.5 20 group 1
1.15
2.0 2.20 17 group 2
F19,16,0.025 =0.386 F15,12,0.05 = 0.404 F16,10,0.025=0.335
F19,16,0.05 = 0.451 F15,12,0.1 0.496 F16.10,0.05=0.401
F16,19,0.025 0.371 F12,15,0.05 =0.382 F10.16,0.025 =0.286
F16,19,0.05 0.437 F12150.1 0.475 F10,16,0.05 0.354
Construct a 95% confidence interval for the ratio of the variances. [ Write only the final result
[ in the box below
Expert Solution
This question has been solved!
Explore an expertly crafted, step-by-step solution for a thorough understanding of key concepts.

Step by stepSolved in 2 steps with 1 images

Knowledge Booster


Learn more about
Need a deep-dive on the concept behind this application? Look no further. Learn more about this topic, statistics and related others by exploring similar questions and additional content below.Similar questions
- A medical researcher wants to test whether the mean cholesterol levels are the same for 3 treatment groups of subjects (with 18 total randomly selected subjects): those who take a new medication, those who follow a diet, and those who make no changes to medication or diet. They plan to use a 5% level of significance for their decision. Below is a partial Analysis of Variance table. Use it to answer the following questions deg of freedom Sum of Squares Mean Square F statistic Treatment Group 3.121 1.5607 Error 1.517 0.1011 Total 17 What are the degrees of freedom for the treatment groups? What are the degrees of freedom for the error? What is the F-statistic for this data (3 decimal places)arrow_forwardFor a marketing class term project, Bob is investigating whether college seniors eat lessfrequently in fast-food chains than college freshmen. He asked 11 freshmen and 11 seniors tokeep track of how many times they ate in a fast-food restaurant during the month of October.Assuming equal variances, can you conclude that the mean is significantly smaller for collegeseniors at the 5 percent level of significance?Seniors Freshmen10 165 919 1615 145 1810 1018 198 1520 97 178 20arrow_forwardUse Excel’s Data Analysis tool to conduct a multiple regression, using Risk of Stroke as the dependent variable, and all the rest of variables as independent variables. Choose confidence level at 99%. Risk of Stroke (%) Age Pressure Smoker (Yes=1) 12 57 152 0 24 67 163 0 13 58 155 0 56 86 177 1 28 59 196 0 51 76 189 0 18 56 155 1 31 78 120 0 37 80 135 1 15 78 98 0 22 71 152 0 36 70 173 1 15 67 135 1 48 77 209 0 15 60 199 0 36 82 119 1 8 66 166 0 34 80 125 1 3 62 117 0 37 59 207 1 Interpret the multiple coefficient of determination R-square. Compare the R-square of the simple linear regression and the R-square of the multiple regression, what does the differences in R-squares tell us? What does F-test for significance tell us?arrow_forward
- In a study of birth order and intelligence, IQ tests were given to 18- and 19-year-old men to estimate the size of the difference, if any, between the mean IQs of firstborn sons and secondborn sons. The following data for 10 firstborn sons and 10 secondborn sons are consistent with the means and standard deviations reported in the article. It is reasonable to assume that the samples come from populations that are approximately normal. Can you conclude that the mean IQ of firstborn sons is greater than the mean IQ of secondborn sons? Let μ1 denote the mean IQ of firstborn sons and μ2 denote the mean IQ of secondborn sons. Use the α = 0.01 level and the P-value method with the table. Firstborn 128 101 128 112 121 105 122 98 106 108 Secondborn 121 125 110 107 114 93 80 94 91 83 Part(a): State the appropriate null and alternate hypotheses. H0: H1: This is a _____…arrow_forwardWhich outcome is expected if the null hypothesis is true for an analysis of variance? a. SSbetween should be about the same size as SStotal. b. SSbetween should be about the same size as SSwithin. c. MSbetween should be about the same size as MStotal. d. MSbetween should be about the same size as MSwithin.arrow_forward
arrow_back_ios
arrow_forward_ios
Recommended textbooks for you
- MATLAB: An Introduction with ApplicationsStatisticsISBN:9781119256830Author:Amos GilatPublisher:John Wiley & Sons Inc
 Probability and Statistics for Engineering and th...StatisticsISBN:9781305251809Author:Jay L. DevorePublisher:Cengage Learning
 Statistics for The Behavioral Sciences (MindTap C...StatisticsISBN:9781305504912Author:Frederick J Gravetter, Larry B. WallnauPublisher:Cengage Learning
  Elementary Statistics: Picturing the World (7th E...StatisticsISBN:9780134683416Author:Ron Larson, Betsy FarberPublisher:PEARSON
 The Basic Practice of StatisticsStatisticsISBN:9781319042578Author:David S. Moore, William I. Notz, Michael A. FlignerPublisher:W. H. Freeman
 Introduction to the Practice of StatisticsStatisticsISBN:9781319013387Author:David S. Moore, George P. McCabe, Bruce A. CraigPublisher:W. H. Freeman
MATLAB: An Introduction with Applications
Statistics
ISBN:9781119256830
Author:Amos Gilat
Publisher:John Wiley & Sons Inc
Probability and Statistics for Engineering and th...
Statistics
ISBN:9781305251809
Author:Jay L. Devore
Publisher:Cengage Learning
Statistics for The Behavioral Sciences (MindTap C...
Statistics
ISBN:9781305504912
Author:Frederick J Gravetter, Larry B. Wallnau
Publisher:Cengage Learning
Elementary Statistics: Picturing the World (7th E...
Statistics
ISBN:9780134683416
Author:Ron Larson, Betsy Farber
Publisher:PEARSON
The Basic Practice of Statistics
Statistics
ISBN:9781319042578
Author:David S. Moore, William I. Notz, Michael A. Fligner
Publisher:W. H. Freeman
Introduction to the Practice of Statistics
Statistics
ISBN:9781319013387
Author:David S. Moore, George P. McCabe, Bruce A. Craig
Publisher:W. H. Freeman