MATLAB: An Introduction with Applications
6th Edition
ISBN: 9781119256830
Author: Amos Gilat
Publisher: John Wiley & Sons Inc
expand_more
expand_more
format_list_bulleted
Concept explainers
Topic Video
Question

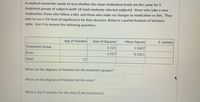
Transcribed Image Text:A medical researcher wants to test whether the mean cholesterol levels are the same for 3
treatment groups of subjects (with 18 total randomly selected subjects): those who take a new
medication, those who follow a diet, and those who make no changes to medication or diet. They
plan to use a 5% level of significance for their decision. Below is a partial Analysis of Variance
table. Use it to answer the following questions
deg of freedom
Sum of Squares
Mean Square
F statistic
Treatment Group
3.121
1.5607
Error
1.517
0.1011
Total
17
What are the degrees of freedom for the treatment groups?
What are the degrees of freedom for the error?
What is the F-statistic for this data (3 decimal places)
Expert Solution
This question has been solved!
Explore an expertly crafted, step-by-step solution for a thorough understanding of key concepts.
Step by stepSolved in 3 steps with 3 images

Knowledge Booster
Learn more about
Need a deep-dive on the concept behind this application? Look no further. Learn more about this topic, statistics and related others by exploring similar questions and additional content below.Similar questions
- Construct a numerical example, i.e., a data set, such that a two-sample t-test will yield an insignificant test result but a pair t-test will yield a significant test result. (For the two-sample t-test, you can either assume equal variances or unequal variances, which will not affect the key idea of this question.) I need to know how this is possible and what the basics of making this data set should be.arrow_forwardplease don't provide hand writtin solution....arrow_forwardThe variance in a production process is an importance measure of the quality of the process. A large variance often signals an opprotunity for improvement in the process by finding ways to reduce the process variance. The conduct a statistical test to determine whether there is a significant differeence between the variance in the bag weights for two machines. Use a 0.05 level of significance. What is your conclusion? Which machine, if either, provides the greater opportunity for quality improvements? Machine 1 Machine 2 2.95 3.22 3.45 3.30 3.50 3.34 3.75 3.28 3.48 3.29 3.26 3.25 3.33 3.30 3.20 3.27 3.16 3.38 3.20 3.34 3.22 3.35 3.38 3.19 3.90 3.35 3.36 3.05 3.25 3.36 3.28 3.28 3.20 3.30 3.22 3.28 2.98 3.30 3.45 3.20 3.70 3.16 3.34 3.33 3.18 3.35 3.12 Please use excelarrow_forward
- I understand how to find the f-ratio and generate a conclusion however I am really struggling with the p-values.arrow_forwardPost-hoc tests are necessary for an analysis of variance comparing only two treatment conditions. t or farrow_forwardA school psychologist is interested in whether or not teachers affect the anxiety scores among students taking the Statistics exam. The data below are the standardized anxiety test scores for students with the three different teachers. Teacher’s Name Ms. San Pedro Ms. San Juan Ms. San Jose 8 23 22 10 14 18 12 12 14 11 8 22 13 15 22 15 16 10 16 14 11 17 19 9 9 10 10 13 Perform an analysis of variance at the 0.05 level of significance.arrow_forward
- We give the total variation, the unexplained variation (SSE), and the least squares point estimate b1 . Total variation = 13.459; SSE = 2.806; b1 = 2.6652 Click here for the Excel Data File Using the information given, find the explained variation, the simple coefficient of determination (r2), and the simple correlation coefficient (r). Interpret r2. (Round your answers to 3 decimal places. Round your percent to 1 decimal place.) Explained variation r2 r % of the variation in demand can be explained by variation in price differential.arrow_forwardplease assist I am lostarrow_forwardWhich of the following correctly represents the coefficient of determination in terms of the variance that is an output from the analysis of variance table? Select one. explained variance + unexplained variance total variance unexplained variance total variance total variance explained variance total variancearrow_forward
arrow_back_ios
arrow_forward_ios
Recommended textbooks for you
 MATLAB: An Introduction with ApplicationsStatisticsISBN:9781119256830Author:Amos GilatPublisher:John Wiley & Sons Inc
 Probability and Statistics for Engineering and th...StatisticsISBN:9781305251809Author:Jay L. DevorePublisher:Cengage Learning
 Statistics for The Behavioral Sciences (MindTap C...StatisticsISBN:9781305504912Author:Frederick J Gravetter, Larry B. WallnauPublisher:Cengage Learning
 Elementary Statistics: Picturing the World (7th E...StatisticsISBN:9780134683416Author:Ron Larson, Betsy FarberPublisher:PEARSON
 The Basic Practice of StatisticsStatisticsISBN:9781319042578Author:David S. Moore, William I. Notz, Michael A. FlignerPublisher:W. H. Freeman
 Introduction to the Practice of StatisticsStatisticsISBN:9781319013387Author:David S. Moore, George P. McCabe, Bruce A. CraigPublisher:W. H. Freeman

MATLAB: An Introduction with Applications
Statistics
ISBN:9781119256830
Author:Amos Gilat
Publisher:John Wiley & Sons Inc

Probability and Statistics for Engineering and th...
Statistics
ISBN:9781305251809
Author:Jay L. Devore
Publisher:Cengage Learning

Statistics for The Behavioral Sciences (MindTap C...
Statistics
ISBN:9781305504912
Author:Frederick J Gravetter, Larry B. Wallnau
Publisher:Cengage Learning

Elementary Statistics: Picturing the World (7th E...
Statistics
ISBN:9780134683416
Author:Ron Larson, Betsy Farber
Publisher:PEARSON

The Basic Practice of Statistics
Statistics
ISBN:9781319042578
Author:David S. Moore, William I. Notz, Michael A. Fligner
Publisher:W. H. Freeman

Introduction to the Practice of Statistics
Statistics
ISBN:9781319013387
Author:David S. Moore, George P. McCabe, Bruce A. Craig
Publisher:W. H. Freeman