MATLAB: An Introduction with Applications
6th Edition
ISBN: 9781119256830
Author: Amos Gilat
Publisher: John Wiley & Sons Inc
expand_more
expand_more
format_list_bulleted
Question

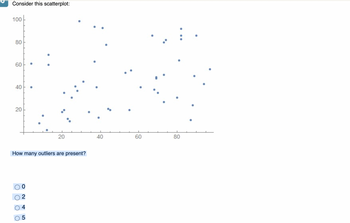
Transcribed Image Text:Consider this scatterplot:
100
80
60
12
40
20
20
How many outliers are present?
ос O
40
60
80
Expert Solution
This question has been solved!
Explore an expertly crafted, step-by-step solution for a thorough understanding of key concepts.
Step by stepSolved in 2 steps with 3 images

Knowledge Booster
Similar questions
- Identify the outlier(s) in the scatterplot shown below and write as an ordered pair in the form (a,b). 6.0 15.0 4.0 13.0 2.0 1.0 1.0 2.0 3.0 4.0 5.0 6.0 ŷ + 2s 27 ŷ - 2sarrow_forwardPls help ASAParrow_forwardStudents at a high school were polled to determine the type of music they preferred. There were 1960 students who completed the poll. Their responses are represented in the circle graph. Music Preferences O Rap 906 O Alternative 478 What percent of students preferred country music? Rock and Roll 280 Country 166 Jazz 35 Other 95 ..... About % of the students who completed the poll preferred country music. (Round to one decimal place as needed.)arrow_forward
- How many outliers would be considered in this data? Something is wrong with my lower and upper formulas City Median Household Income Morgantown, WV $ 38,060 Fayetteville, AR $ 40,835 Wooster, OH $ 43,054 max $ 138,192.00 =MAX(B:B) Council Bluffs, IA $ 46,844 min $ 38,060.00 =MIN(B:B) Bossier City, LA $ 47,051 mean $ 72,342.94 =AVERAGE(B:B) St. Augustine, FL $ 47,748 median $ 66,743.00 =MEDIAN(B:B) Rapid City, SD $ 47,788 range $ 100,132.00 =E4-E5 Bozeman, MT $ 49,303 std deviation $ 23,711.80 =STDEV.S(B:B) Sparks, NV $ 54,230 first quartile $…arrow_forwardJeff took 15 quizzes in his Calculus class. His quiz scores had the following 5 number summary. Based on this 5 number summary, are any of his quiz scores potentially an outlier? Min = 4 Q1 = 8 Median = 8.5 Q3 = 9 Max = 10arrow_forwardAnna teaches a small class of 14 students. She recently gave them an exam (out of 100 points). The scores on the exam were: 0, 15, 58, 75, 78, 82, 84, 84, 89, 91, 94, 98, 100, and 100. How many of the scores are potential outliers? a. 1 b. 0 c. 3 d. 2 e. Impossible to Determinearrow_forward
- When people were asked how much money they spent yesterday (in dollars), this was their data: 7 20 1 34 50 20 60 25 38 30 20 350 50 11 30 100 167 20 18 20 120 65 60 30 3 1000 100 32 20 300 70 0. Find the minimum and maximum of the data. 1. Find the apparent outliers of the data. 2. Create a stemplot of values up to 167, and put outliers at the end. 3. Using a "range" of 0-167, find a reasonable interval size ( ). ": 4. Make a frequency table of the data, with a first interval of 5. Create a histogram of the data from the frequency table. (Put your outliers in a box.) 6. Check your work by replicating the histogram on your calculator.arrow_forwardUse the following data set to answer Questions #12 and #13. 65 55 65 54 60 57 55 58 63 58 57 65 57 58 84 Are there any outliers? There exists at least one outlier in the data set at 84. There exists outliers in the data set at 55 and 84. O There are no outliers in the data set.arrow_forwardUnder each boxplot, write a comment about the presence or absence of any outliers (for example, there are __number of outliers or there are no outliers in the ________data)arrow_forward
- PLS HELP 3arrow_forwardA pet supply company has surveyed 887 of its customers to determine the types of pets that its customers have. The percent, rounded to the nearest whole number percent, in each category is pictured here. Other 18% Both 15% Cat 26% 18% 15% 26% 41% Dog 41% How many of its 887 customers have just a dog?arrow_forwardIn the data set below, 2 is an outlier: 2, 6, 7, 9, 10, 7, 8, 6, 10, 7 O True O Falsearrow_forward
arrow_back_ios
SEE MORE QUESTIONS
arrow_forward_ios
Recommended textbooks for you
 MATLAB: An Introduction with ApplicationsStatisticsISBN:9781119256830Author:Amos GilatPublisher:John Wiley & Sons Inc
 Probability and Statistics for Engineering and th...StatisticsISBN:9781305251809Author:Jay L. DevorePublisher:Cengage Learning
 Statistics for The Behavioral Sciences (MindTap C...StatisticsISBN:9781305504912Author:Frederick J Gravetter, Larry B. WallnauPublisher:Cengage Learning
 Elementary Statistics: Picturing the World (7th E...StatisticsISBN:9780134683416Author:Ron Larson, Betsy FarberPublisher:PEARSON
 The Basic Practice of StatisticsStatisticsISBN:9781319042578Author:David S. Moore, William I. Notz, Michael A. FlignerPublisher:W. H. Freeman
 Introduction to the Practice of StatisticsStatisticsISBN:9781319013387Author:David S. Moore, George P. McCabe, Bruce A. CraigPublisher:W. H. Freeman

MATLAB: An Introduction with Applications
Statistics
ISBN:9781119256830
Author:Amos Gilat
Publisher:John Wiley & Sons Inc

Probability and Statistics for Engineering and th...
Statistics
ISBN:9781305251809
Author:Jay L. Devore
Publisher:Cengage Learning

Statistics for The Behavioral Sciences (MindTap C...
Statistics
ISBN:9781305504912
Author:Frederick J Gravetter, Larry B. Wallnau
Publisher:Cengage Learning

Elementary Statistics: Picturing the World (7th E...
Statistics
ISBN:9780134683416
Author:Ron Larson, Betsy Farber
Publisher:PEARSON

The Basic Practice of Statistics
Statistics
ISBN:9781319042578
Author:David S. Moore, William I. Notz, Michael A. Fligner
Publisher:W. H. Freeman

Introduction to the Practice of Statistics
Statistics
ISBN:9781319013387
Author:David S. Moore, George P. McCabe, Bruce A. Craig
Publisher:W. H. Freeman