
ENGR.ECONOMIC ANALYSIS
14th Edition
ISBN: 9780190931919
Author: NEWNAN
Publisher: Oxford University Press
expand_more
expand_more
format_list_bulleted
Related questions
Question
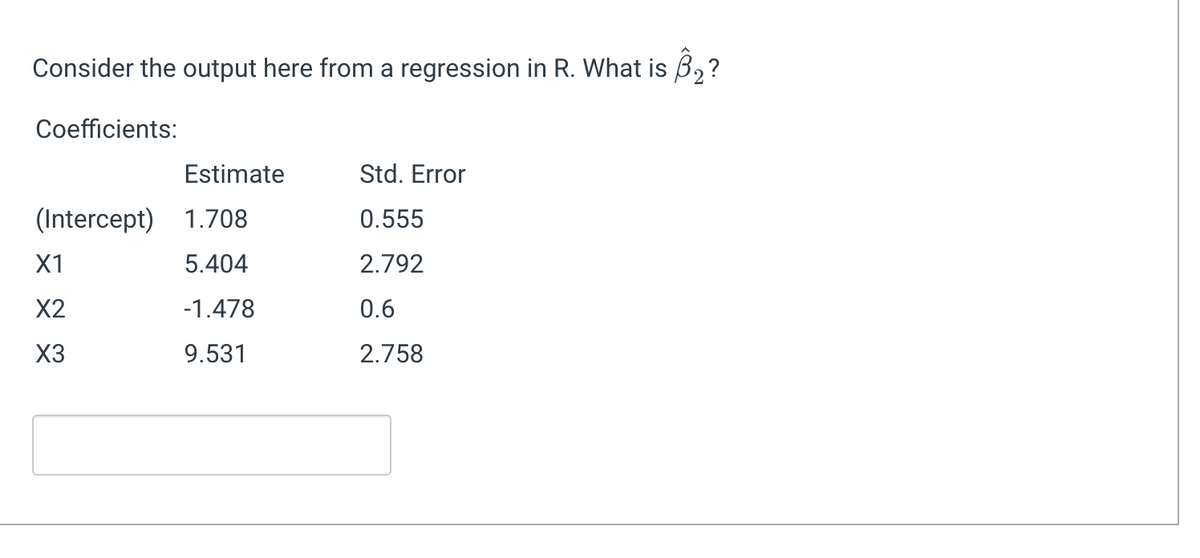

Transcribed Image Text:Consider the output here from a regression in R. What is 3₂?
Coefficients:
Estimate
(Intercept) 1.708
5.404
-1.478
9.531
X1
X2
X3
Std. Error
0.555
2.792
0.6
2.758
Expert Solution
This question has been solved!
Explore an expertly crafted, step-by-step solution for a thorough understanding of key concepts.

Step by stepSolved in 2 steps

Knowledge Booster


Learn more about
Need a deep-dive on the concept behind this application? Look no further. Learn more about this topic, economics and related others by exploring similar questions and additional content below.Similar questions
- A regression analysis of company profits and the amount of money the company spent on advertising produced a R² = 0.72. Which of these is TRUE? 1. This model can correctly predict the profit for 72% of companies. II. 72% of the variance in company profit can be accounted for by the model. III. On average, companies spend about 72% of their profits on advertising. OA. None OB. I and III OC. II only OD. III only OE. I onlyarrow_forwardYou estimated a regression with the following output. Source | SS df MS Number of obs = 289 -------------+---------------------------------- F(1, 287) = 41986.64 Model | 664544048 1 664544048 Prob > F = 0.0000 Residual | 4542496.25 287 15827.5131 R-squared = 0.9932 -------------+---------------------------------- Adj R-squared = 0.9932 Total | 669086544 288 2323217.17 Root MSE = 125.81 ------------------------------------------------------------------------------ Y | Coef. Std. Err. t P>|t| [95% Conf. Interval] -------------+---------------------------------------------------------------- X | 43.81013 .2138056 204.91 0.000 43.38931 44.23096 _cons | 49.31707 16.96222 2.91 0.004 15.93094 82.70319…arrow_forwardIn an OLS regression, which value represents the "best" R2 in terms of explained variance in the dependent variable? A. 2.53 B. 16.22 C. .001 D. 0.53arrow_forward
- Help!arrow_forwardYou estimated a regression with the following output. Source | SS df MS Number of obs = 411 -------------+---------------------------------- F(1, 409) = 4098.54 Model | 22574040.7 1 22574040.7 Prob > F = 0.0000 Residual | 2252702.97 409 5507.83122 R-squared = 0.9093 -------------+---------------------------------- Adj R-squared = 0.9090 Total | 24826743.7 410 60553.0334 Root MSE = 74.215 ------------------------------------------------------------------------------ Y | Coef. Std. Err. t P>|t| [95% Conf. Interval] -------------+---------------------------------------------------------------- X | 6.727341 .1050822 64.02 0.000 6.520772 6.933909 _cons | -.7552724 9.26027 -0.08 0.935 -18.95894 17.44839…arrow_forwardAn analyst working for your firm provided an estimated log-linear demand function based on the natural logarithm of the quantity sold, price, and the average income of consumers. Results are summarized in the following table: SUMMARY OUTPUT Regression Statistics Multiple R R Square Adjusted R Square Standard Error Observations ANOVA Regression Residual Total Intercept LN Price LN Income df 0.968 0.937 0.933 0.003 30 SS MS F 2 0.003637484 0.001818742 202.48598 0.000242516 8.98206E-06 27 29 0.00388 Coefficients Standard Error 0.57 0.00 0.13 0.51 -0.08 0.15 t Stat 0.90 -19.50 1.13 P-value 0.37 0.00 0.27 Significance F 5.55598E-17 Lower 95% -0.65 -0.09 -0.12 How would a 4 percent increase in income impact the demand for your product? Demand would increase by 60 percent. Demand would increase by 0.6 percent. Demand would decrease by 60 percent. Demand would decrease by 0.6 percent. Upper 95% 1.68 -0.07 0.41arrow_forward
- q11-arrow_forwardYou estimated a regression with the following output. Source | SS df MS Number of obs = 335 -------------+---------------------------------- F(1, 333) = 69555.83 Model | 211169628 1 211169628 Prob > F = 0.0000 Residual | 1010979.01 333 3035.97301 R-squared = 0.9952 -------------+---------------------------------- Adj R-squared = 0.9952 Total | 212180607 334 635271.28 Root MSE = 55.1 ------------------------------------------------------------------------------ Y | Coef. Std. Err. t P>|t| [95% Conf. Interval] -------------+---------------------------------------------------------------- X | 44.15183 .1674102 263.73 0.000 43.82251 44.48114 _cons | 31.63715 16.49849 1.92 0.056 -.8172452 64.09155…arrow_forwardQ1arrow_forward
- The following question refers to this regression equation (standard errors for each of the estimated coefficients are in parenthesis). Q=8,400-8" P+5" A+ 4** Px +0.05**1, (1,732) (2.29) (1.36) (1.75) (0.15) Q = Quantity demanded P = Price 1,100 Advertising expenditures, in thousands = 20 P = price of competitor's good = 600/= average monthly income 10,000 What is the advertising elasticity of demand? Round your answer to two decimal places. Your Answer: The t-statistic is computed by dividing the regression coefficient by the standard error of the coefficient. dividing the regression coefficient by the standard error of the estimate. dividing the standard error of the coefficient by the regression coefficient. dividing the R2 by the F-statistic. none of the specified answers are correct.arrow_forwardConsider the following computer output of a multiple regression analysis relating annual salary to years of education and years of work experience. Regression Statistics Multiple R 0.7339 R Square 0.5386 Adjusted R Square 0.5185 Standard Error 2137.5200 Observations 49 ANOVA SS df Regression 2 245,370,679.3850 122,685,339.6925 26.8517 MS F Significance F 1.9E-08 Total Residual 46 210,173,612.6150 48 455,544,292.0000 4,568,991.5786 Coefficients Standard Error Intercept Education (Years) 14290.37278 2350.8671 2,528.5819 338.1140 Experience (Years) 829.3167 392.5627 t Stat P-value 5.6515 0.000000961 9200.6014 6.9529 0.000000011 2.1126 0.040093183 Lower 95 % Upper 95% 19,380.1442 1670.2789 3031.4553 39.129 1619.5044 Step 2 of 2: How much would you expect your salary to increase if you had one more year of education?arrow_forwardYou estimated a regression with the following output. Source | SS df MS Number of obs = 268 -------------+---------------------------------- F(1, 266) = 23.48 Model | 668419.175 1 668419.175 Prob > F = 0.0000 Residual | 7572666.51 266 28468.6711 R-squared = 0.0811 -------------+---------------------------------- Adj R-squared = 0.0777 Total | 8241085.68 267 30865.4895 Root MSE = 168.73 ------------------------------------------------------------------------------ Y | Coef. Std. Err. t P>|t| [95% Conf. Interval] -------------+---------------------------------------------------------------- X | 1.014128 .2092916 4.85 0.000 .6020489 1.426207 _cons | 9.173163 21.13463 0.43 0.665 -32.43929 50.78561…arrow_forward
arrow_back_ios
SEE MORE QUESTIONS
arrow_forward_ios
Recommended textbooks for you
 Principles of Economics (12th Edition)EconomicsISBN:9780134078779Author:Karl E. Case, Ray C. Fair, Sharon E. OsterPublisher:PEARSON
 Engineering Economy (17th Edition)EconomicsISBN:9780134870069Author:William G. Sullivan, Elin M. Wicks, C. Patrick KoellingPublisher:PEARSON
 Principles of Economics (MindTap Course List)EconomicsISBN:9781305585126Author:N. Gregory MankiwPublisher:Cengage Learning
 Managerial Economics: A Problem Solving ApproachEconomicsISBN:9781337106665Author:Luke M. Froeb, Brian T. McCann, Michael R. Ward, Mike ShorPublisher:Cengage Learning
 Managerial Economics & Business Strategy (Mcgraw-...EconomicsISBN:9781259290619Author:Michael Baye, Jeff PrincePublisher:McGraw-Hill Education
Principles of Economics (12th Edition)
Economics
ISBN:9780134078779
Author:Karl E. Case, Ray C. Fair, Sharon E. Oster
Publisher:PEARSON
Engineering Economy (17th Edition)
Economics
ISBN:9780134870069
Author:William G. Sullivan, Elin M. Wicks, C. Patrick Koelling
Publisher:PEARSON
Principles of Economics (MindTap Course List)
Economics
ISBN:9781305585126
Author:N. Gregory Mankiw
Publisher:Cengage Learning
Managerial Economics: A Problem Solving Approach
Economics
ISBN:9781337106665
Author:Luke M. Froeb, Brian T. McCann, Michael R. Ward, Mike Shor
Publisher:Cengage Learning
Managerial Economics & Business Strategy (Mcgraw-...
Economics
ISBN:9781259290619
Author:Michael Baye, Jeff Prince
Publisher:McGraw-Hill Education