
ENGR.ECONOMIC ANALYSIS
14th Edition
ISBN: 9780190931919
Author: NEWNAN
Publisher: Oxford University Press
expand_more
expand_more
format_list_bulleted
Related questions
Question

Transcribed Image Text:210
PRICE (Dollars per handbag).
180 Tax Wedge
150
120
90
00
60
60
30
Supply
0
0 20
40
60 80 100 120 140 160 180 200
QUANTITY (Handbags)
A
Consumer Surplus
Producer Surplus
Deadweight Loss
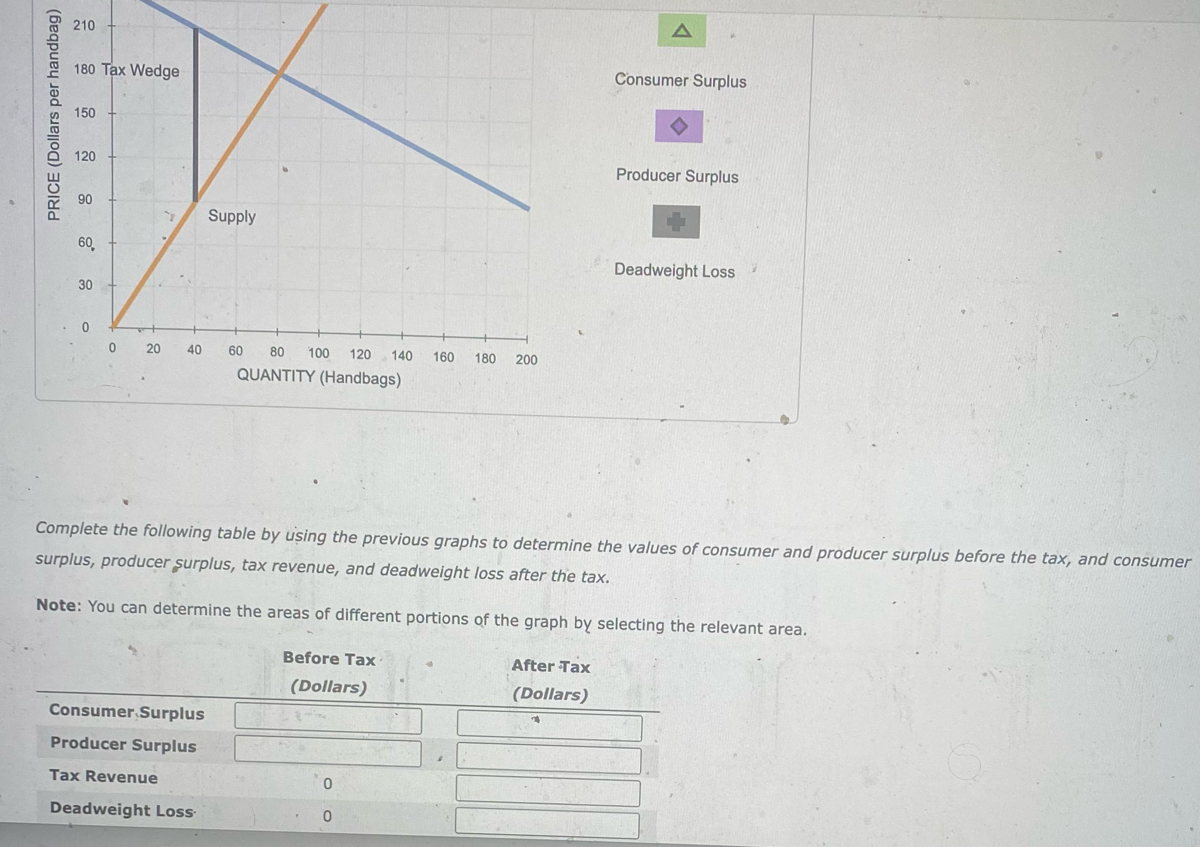
Complete the following table by using the previous graphs to determine the values of consumer and producer surplus before the tax, and consumer
surplus, producer surplus, tax revenue, and deadweight loss after the tax.
Note: You can determine the areas of different portions of the graph by selecting the relevant area.
Before Tax
(Dollars)
After Tax
(Dollars)
Consumer Surplus
Producer Surplus
Tax Revenue
0
Deadweight Loss
0

Transcribed Image Text:Consider the market for designer handbags. The following graph shows the demand and supply for designer handbags before the government imposes
any taxes.
First, use the black point (plus symbol) to indicate the equilibrium price and quantity of designer handbags in the absence of a tax. Then use the green
point (triangle symbol) to shade the area representing total consumer surplus (CS) at the equilibrium price. Next, use the purple point (diamond
symbol) to shade the area representing total producer surplus (PS) at the equilibrium price.
?
PRICE (Dollars per handbag)
300
270
Demand
240
210
180
150
120
90
Supply
60
30
0
Before Tax
Equilibrium
A
Consumer Surplus
Producer Surplus
Cancer
Create
Expert Solution
This question has been solved!
Explore an expertly crafted, step-by-step solution for a thorough understanding of key concepts.

Step by stepSolved in 2 steps with 4 images

Knowledge Booster

Similar questions
- 9. Effect of a tax on buyers and sellers The following graph shows the daily market for wine when the tax on sellers is set at $0 per bottle. Suppose the government institutes a tax of $40.60 per bottle, to be paid by the seller. (Hint: To see the impact of the tax, enter the value of the tax in the Tax on Sellers field and move the green line to the after-tax equilibrium by adjusting the value in the Quantity field. Then, enter zero in the Tax on Sellers field. You should see a tax wedge between the price buyers pay and the price sellers receive.) Use the graph input tool to help you answer the following questions. You will not be graded on any changes you make to this graph. Note: Once you enter a value in a white field, the graph and any corresponding amounts in each grey field will change accordingly. 200 PRICE (Dollars per bottle) 160 Supply 140 120 100 14 80 Demand 60 40 20 0 10 20 30 40 50 60 70 80 90 100 QUANTITY (Bottles of wine) 180 0 Before Tax After Tax Graph Input Tool…arrow_forwardThe figure below shows a market of good C. Suppose that the government levied a tax on C. Suppose that the consumers’ tax incidence is 15 and the price sellers receive is 8 when the size of the tax is T. Answer the value of T. Hint: Remember the relationship between the tax incidences and the size of tax.arrow_forwardNonearrow_forward
- 6) The following graph shows the effect of a per-ticket tax on plane tickets from Boston to Tampa. Use the graph to answer questions 5 to 10. O $10 $30 $40 Price (P) of airline tickets (in dollars per ticket) What is the amount of the tax per ticket from Boston to Tampa? $20 230 200 190 2850 3000 with tax D Sno tax Figure 14 Image author created Quantity (Q) of airline tickets (thousands per day)arrow_forwardSuppose the Canadian government has decided to place an excise tax of $20 per tire on producers of automobile tires Excise taxes are also called sales or commodity taxes 150 Previously, there was no excise tax on automobile tires. As 140 a result of the excise tax, producers of tires, such as 130 Bridgestone and Michelin, are going to alter their tire prices The graph illustrates the demand and supply curves for 120 Supply Demand 110 100 automobile tires before the excise tax. 90 Please shift the appropriate curve or curves on the graph to demonstrate the new equilibrium 80 70 What is the price consumers pay for a tire post tax? Round 60 to the nearest 10 50 0 2 4 5 6 7 8 9 10 Quantity of tires 100 price paid by consumers: Price per tire coarrow_forwardAttached is a graph diagram depicting the market for soft drinks. If an excise tax equal to $1 per liter is levied on soft drink sellers, please answer the following questions: a. The new equilibrium quantity of soft drinks bought and sold would be ___________ million liters. b. The new equilibrium price paid by buyers of soft drinks would be $__________ per liter. c. The new equilibrium price received by sellers (after-tax) would be $__________ per liter.arrow_forward
- Only typed answerarrow_forwardRefer to the figure, Price (dollars) 600 550 500 450 400 350 300 250 200 150 100 50 0 Market for Game Consoles S 10 20 30 40 50 60 70 80 90 100110 Quantity Toola DL 0 O Use the graph to show the area representing the deadweight loss, and then determine the deadweight loss created as a result of setting the price at $150. Instructions: Use the tool provided "DL to illustrate this area on the graph. Deadweight loss: $arrow_forwardN7arrow_forward
- Urgently needarrow_forwardThe table shows the market for chocolate bars Quantity demanded Quantity supplied (thousands per day) Price (dollars per chocolate bar) 1.10 1.20 1.30 1.40 1.50 50 5 40 10 30 15 20 20 10 25 A tax of $0.30 per chocolate bar is imposed on sellers What is the new price of a chocolate bar? Who pays the tax? The new price of a chocolate bar following the tax is $ The tax is A. paid totally by the buyer B. paid totally by the seller C. split between the buyer and the sellerarrow_forwardKel ng Time: * Question Completion Status: The vertical distance between points and represents a tax in the market. PRICE 12 10 9 8 CO 76 5 inutes, 37 seconds. 4 3 2 1 A B Supply Demand +++ H 0.5 1.0 1.5 2.0 2.5 3.0 3.5 4.0 4.5 5.0 5.5 6) QUANTITY Refer to Figure 8-2. The amount of tax revenue received by the government is a. $2.50. b. $9. c. $4. d. $5. A Moving to another question will save this response. Macarrow_forward
arrow_back_ios
SEE MORE QUESTIONS
arrow_forward_ios
Recommended textbooks for you
 Principles of Economics (12th Edition)EconomicsISBN:9780134078779Author:Karl E. Case, Ray C. Fair, Sharon E. OsterPublisher:PEARSON
 Engineering Economy (17th Edition)EconomicsISBN:9780134870069Author:William G. Sullivan, Elin M. Wicks, C. Patrick KoellingPublisher:PEARSON
 Principles of Economics (MindTap Course List)EconomicsISBN:9781305585126Author:N. Gregory MankiwPublisher:Cengage Learning
 Managerial Economics: A Problem Solving ApproachEconomicsISBN:9781337106665Author:Luke M. Froeb, Brian T. McCann, Michael R. Ward, Mike ShorPublisher:Cengage Learning
 Managerial Economics & Business Strategy (Mcgraw-...EconomicsISBN:9781259290619Author:Michael Baye, Jeff PrincePublisher:McGraw-Hill Education
Principles of Economics (12th Edition)
Economics
ISBN:9780134078779
Author:Karl E. Case, Ray C. Fair, Sharon E. Oster
Publisher:PEARSON
Engineering Economy (17th Edition)
Economics
ISBN:9780134870069
Author:William G. Sullivan, Elin M. Wicks, C. Patrick Koelling
Publisher:PEARSON
Principles of Economics (MindTap Course List)
Economics
ISBN:9781305585126
Author:N. Gregory Mankiw
Publisher:Cengage Learning
Managerial Economics: A Problem Solving Approach
Economics
ISBN:9781337106665
Author:Luke M. Froeb, Brian T. McCann, Michael R. Ward, Mike Shor
Publisher:Cengage Learning
Managerial Economics & Business Strategy (Mcgraw-...
Economics
ISBN:9781259290619
Author:Michael Baye, Jeff Prince
Publisher:McGraw-Hill Education