
ENGR.ECONOMIC ANALYSIS
14th Edition
ISBN: 9780190931919
Author: NEWNAN
Publisher: Oxford University Press
expand_more
expand_more
format_list_bulleted
Related questions
Question
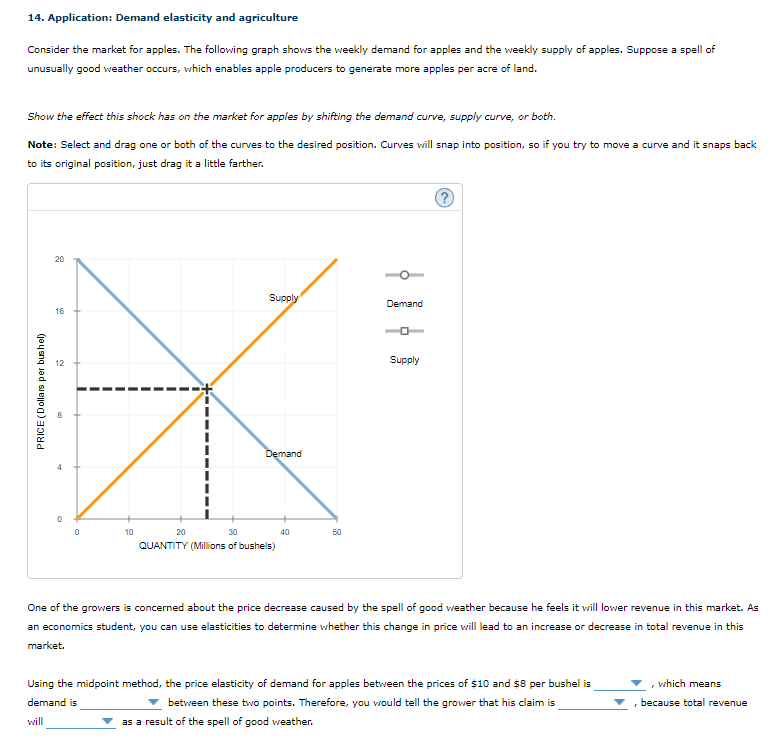

Transcribed Image Text:14. Application: Demand elasticity and agriculture
Consider the market for apples. The following graph shows the weekly demand for apples and the weekly supply of apples. Suppose a spell of
unusually good weather occurs, which enables apple producers to generate more apples per acre of land.
Show the effect this shock has on the market for apples by shifting the demand curve, supply curve, or both.
Note: Select and drag one or both of the curves to the desired position. Curves will snap into position, so if you try to move a curve and it snaps back
to its original position, just drag it a little farther.
20
Supply
Demand
16
Supply
Demand
10
20
30
40
50
QUANTITY (Millions of bushels)
One of the growers is concerned about the price decrease caused by the spell of good weather because he feels it will lower revenue in this market. As
an economics student, you can use elasticities to determine whether this change in price will lead to an increase or decrease in total revenue in this
market.
Using the midpoint method, the price elasticity of demand for apples between the prices of $10 and $8 per bushel is
which means
demand is
between these two points. Therefore, you would tell the grower that his claim is
because total revenue
will
as a result of the spell of good weather.
PRICE (Dollars per bushel)
Expert Solution
This question has been solved!
Explore an expertly crafted, step-by-step solution for a thorough understanding of key concepts.

This is a popular solution

Trending nowThis is a popular solution!

Step by stepSolved in 3 steps with 3 images

Knowledge Booster


Learn more about
Need a deep-dive on the concept behind this application? Look no further. Learn more about this topic, economics and related others by exploring similar questions and additional content below.Similar questions
- Suppose firms exit the market for widgets. This would A (increase/decrease) the A (supply/demand) of widgets. At the same time, health researchers publish research that widgets increase your risk for cancer. This would A (increase/decrease) the A (supply/demand) for our widgets. Suppose the change in demand is stronger than the change in supply, the equilibrium price of widgets (increases/decreases/ambiguously changes). A/ changes), and the equilibrium quantity of widgets A (increases/decreases/ambiguouslyarrow_forwardWhat are some general factors that can impact the demand for a product and the supply of a product? Identify at least two factors for each and explain the different ways these determinants can shift supply and demand either left or right.arrow_forwardNext, complete the following graph 2 "not pictured", labeled Scenario 2, by shifting the supply and demand curves in the same way that you did on the Scenario 1 graph.arrow_forward
- You are a financial analyst with a specialization in the motion pictureIndustry. You have been hired to analyze the prices of movie theater tickets. The following two events are occurring simultaneously in the Ghana:A new national chain opens new multi-screen movie theaters in most cities in Ghana.Movie theaters cut the price of popcorn and soft drinks in half.Draw a demand-and-supply graph showing equilibrium in the market for movie tickets hefore the above two events took place. Label the axes and curves. Label the initial equilibrium — before events (i) and (ii) - as P,and Q, on your graph.b.Now show on your graph how event (i) affects the demand or supply curves for tone teres, Brelly explain which of the demand or supply variables caused the eftect you are showing on your graph.Now slow on your graph how event (il) affects the demand or supply curves for ovis Lesets. Brielly explain which of the demand or supply variables caused the effe you are showing on your graph.Based on your…arrow_forwardThe following graph shows the market for annual tortilla chip consumption, which is initially in long-run equilibrium at point D. After the change in tastes and the rightward shift in demand, the market moves to point in the short run and then to point in the long run. On the following graph, use the purple line (diamond symbol) to plot the long-run market supply curve for tortilla chips, making sure that it goes through two of the points A, B, C, or D. PRICE (Dollars per bag 10 9 8 2 1 D 0 1 True B D₁ O False 23 C S 10²4 NO 2 3 4 5 7 8 QUANTITY (Milions of bags per year) According to the graph, the tortilla chip market is an example of 10 Long-Run Supply True or False: The average cost at the cost-minimizing level of output is lower for the new marginal firm than it was for the marginal firm before the change in demand. industry.arrow_forward
arrow_back_ios
arrow_forward_ios
Recommended textbooks for you
 Principles of Economics (12th Edition)EconomicsISBN:9780134078779Author:Karl E. Case, Ray C. Fair, Sharon E. OsterPublisher:PEARSON
 Engineering Economy (17th Edition)EconomicsISBN:9780134870069Author:William G. Sullivan, Elin M. Wicks, C. Patrick KoellingPublisher:PEARSON
 Principles of Economics (MindTap Course List)EconomicsISBN:9781305585126Author:N. Gregory MankiwPublisher:Cengage Learning
 Managerial Economics: A Problem Solving ApproachEconomicsISBN:9781337106665Author:Luke M. Froeb, Brian T. McCann, Michael R. Ward, Mike ShorPublisher:Cengage Learning
 Managerial Economics & Business Strategy (Mcgraw-...EconomicsISBN:9781259290619Author:Michael Baye, Jeff PrincePublisher:McGraw-Hill Education
Principles of Economics (12th Edition)
Economics
ISBN:9780134078779
Author:Karl E. Case, Ray C. Fair, Sharon E. Oster
Publisher:PEARSON
Engineering Economy (17th Edition)
Economics
ISBN:9780134870069
Author:William G. Sullivan, Elin M. Wicks, C. Patrick Koelling
Publisher:PEARSON
Principles of Economics (MindTap Course List)
Economics
ISBN:9781305585126
Author:N. Gregory Mankiw
Publisher:Cengage Learning
Managerial Economics: A Problem Solving Approach
Economics
ISBN:9781337106665
Author:Luke M. Froeb, Brian T. McCann, Michael R. Ward, Mike Shor
Publisher:Cengage Learning
Managerial Economics & Business Strategy (Mcgraw-...
Economics
ISBN:9781259290619
Author:Michael Baye, Jeff Prince
Publisher:McGraw-Hill Education