
MATLAB: An Introduction with Applications
6th Edition
ISBN: 9781119256830
Author: Amos Gilat
Publisher: John Wiley & Sons Inc
expand_more
expand_more
format_list_bulleted
Related questions
Question
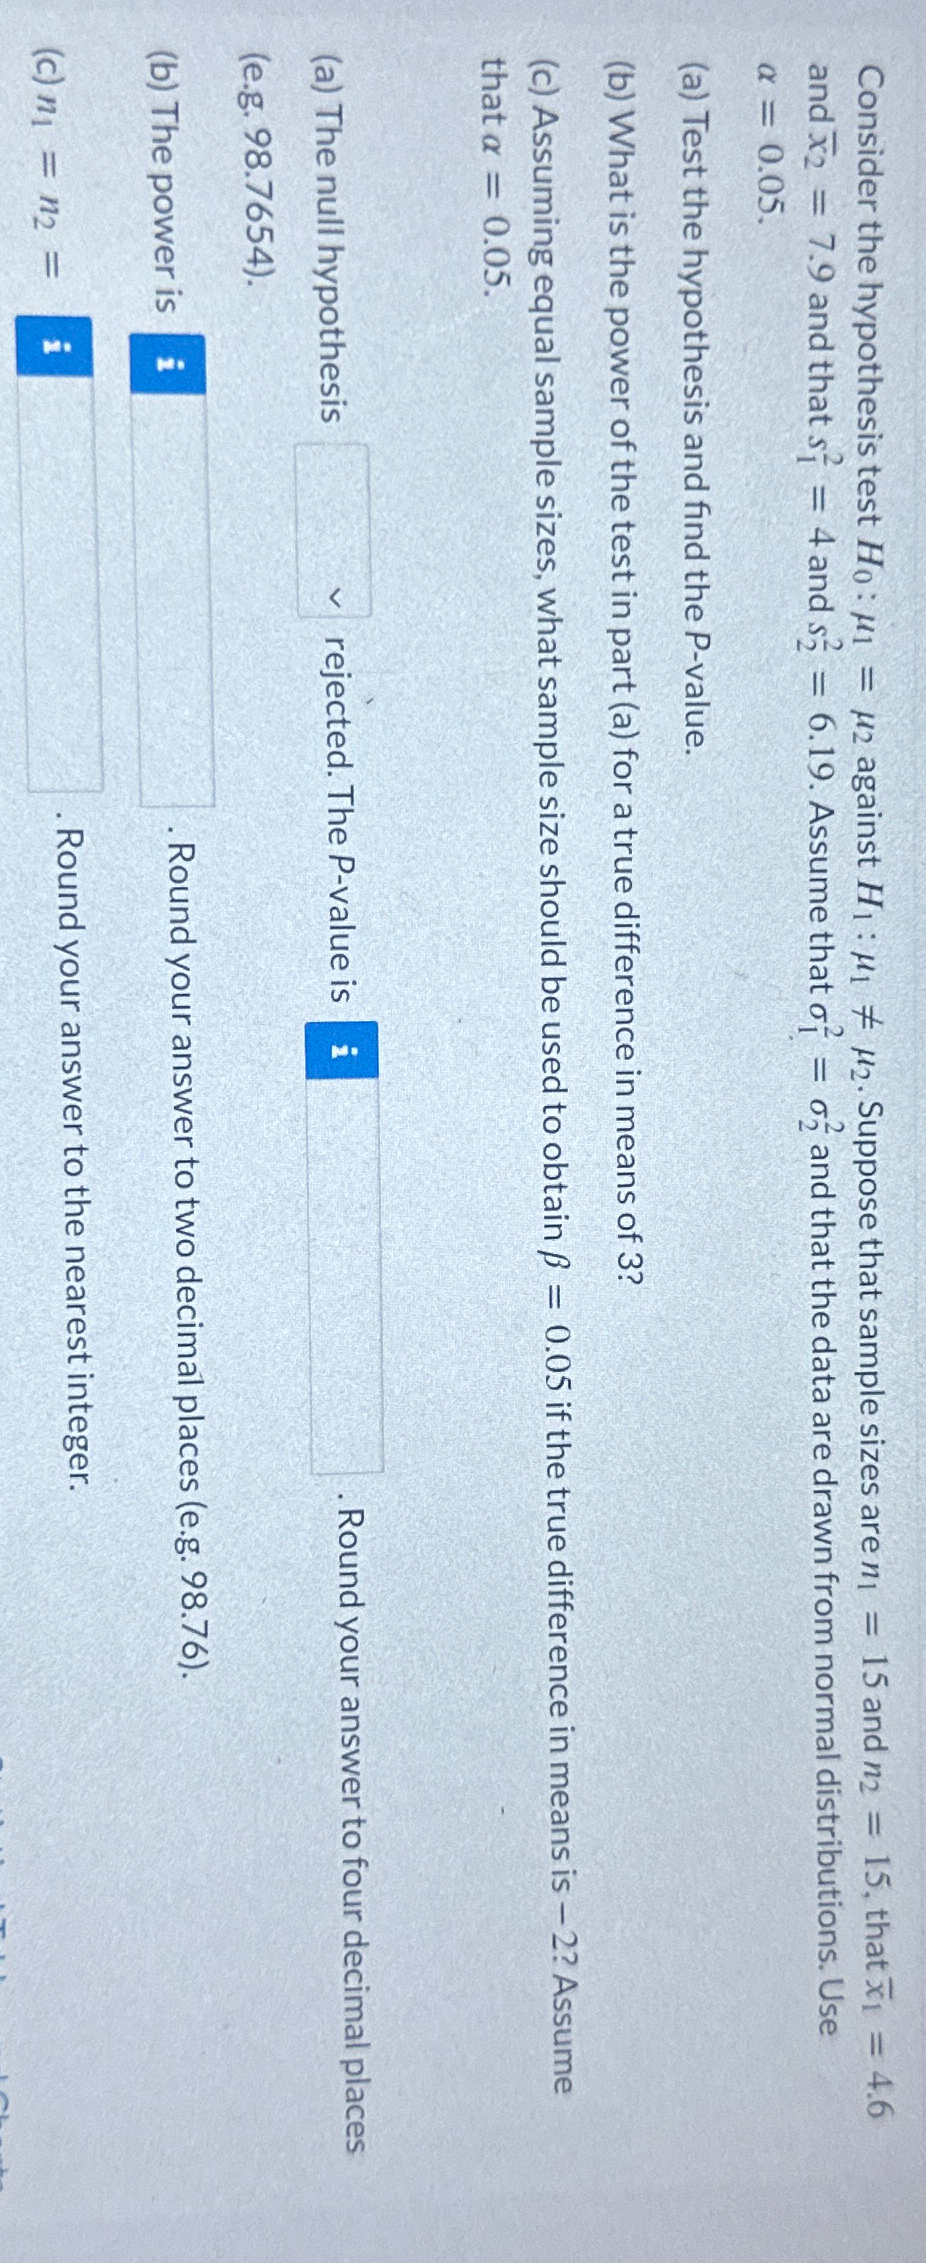

Transcribed Image Text:Consider the hypothesis test Ho: μ₁
and X2
-
α = 0.05.
7.9 and that s 4 and s
=
= μ2 against H₁: M₁
=
μ2. Suppose that sample sizes are n =
15 and 2 15, that x = 4.6
6.19. Assume that o₁ = 0 and that the data are drawn from normal distributions. Use
(a) Test the hypothesis and find the P-value.
(b) What is the power of the test in part (a) for a true difference in means of 3?
(c) Assuming equal sample sizes, what sample size should be used to obtain ẞ = 0.05 if the true difference in means is -2? Assume
that a = 0.05.
(a) The null hypothesis
V
rejected. The P-value is
i
Round your answer to four decimal places
(e.g. 98.7654).
(b) The power is
i
Round your answer to two decimal places (e.g. 98.76).
(c) n₁ = n2 = i
Round your answer to the nearest integer.
SAVE
AI-Generated Solution
info
AI-generated content may present inaccurate or offensive content that does not represent bartleby’s views.
Unlock instant AI solutions
Tap the button
to generate a solution
to generate a solution
Click the button to generate
a solution
a solution
Knowledge Booster

Similar questions
- Test the claim about the differences between two population variances at the given level of significance a using the given sample statistics. Assume that the sample statistics are from independent samples that are randomly selected and each population has a normal distribution. 1. Find the critical value. 2. Find the test statistic.arrow_forwardTest the claim about the difference between two population means µ₁ and µ₂ at the level of significance a. Assume the samples are random and independent, and the populations are normally distributed. Claim: μ₁ μ₂; α=0.10. Assume o² #02 Sample statistics: x₁=2404, s₁ = 177, n₁ = 15 and x₂ = 2299, s₂ = 54, n₂ = 10 Identify the null and alternative hypotheses. Choose the correct answer below. A. Ho: ₁ = ₂ Hai Mi#H2 C. Ho: H₁ H₂ Hai HSM2 E. Ho: H₁ H₂ Ha: ₁ = ₂ Find the standardized test statistic t. t= (Round to two decimal places as needed.) Find the P-value. P= (Round to three decimal places as needed.) Decide whether to reject or fail to reject the null hypothesis and interpret the decision in the context of the original claim. Ho. There enough evidence at the 10% level of significance to reject the claim. B. Ho: H₁ H₂ Ha: ₁ H2arrow_forwardWe have a random sample of 36 data palrs where the sample mean of the differences is 1.18 and the sample standard devlation of the differences Is 3. Then the sample test statistic Is d = 1.18 Using these values, along with u = 0, we calculate the corresponding t value for the test statistic. 1.18 - 0 V V36 0.065arrow_forward
- A sample of 30 observations is selected from a normal population. The sample mean is 59, and the population standard deviation is 8. Conduct the following test of hypothesis using the 0.02 significance level.H0: μ = 62H1: μ ≠ 62 a. Is this a one- or two-tailed test? (One-tailed or Two-tailed) b. What is the decision rule? (Reject H0 if −2.326 < z < 2.326 or Reject H0 if z < −2.326 or z > 2.326) c. What is the value of the test statistic? (Negative amount should be indicated by a minus sign. Round your answer to 2 decimal places.)The value of the test statistic is d. What is your decision regarding H0? (Reject H0 or Fail to reject H0) e-1. What is the p-value? (Round your z value to 2 decimal places and final answer to 4 decimal places.)The p-value is e-2. Interpret the p-value? (Round your z value to 2 decimal places and final answer to 2 decimal places.)There is a % chance of finding a z value this large by "sampling error" When H0 is true.arrow_forwardTest the claim about the difference between two population means μ₁ and μ₂ at the level of significance a. Assume the samples are random and independent, and the populations are normally distributed. Claim: H₁₂; a=0.01. Assume o² #02 Sample statistics: x₁ =2417, s₁ = 174, n₁ = 15 and X2=2301, $255, n₂ = 10 dentify the null and alternative hypotheses. Choose the correct answer below. OA. Ho: H1 H2 Ha H1> H2 OC. Ho: H₁₂ H₂H₁₂ O E. Ho: H1 H2 Hai P1 P2 Find the standardized test statistic t. OB. Ho: H1 H2 D. Ho: H1 H2 H: H₁₂ OF. Ho: 12 Ha H1 H2 Time Remaining: 00:59:29 Next Inserarrow_forwardUse the t-distribution and the sample results to complete the test of the hypotheses. Use a 5% significance level. Assume the results come from a random sample, and if the sample size is small, assume the underlying distribution is relatively normal.Test H0 : μ=15 vs Ha : μ>15 using the sample results x¯=17.2, s=6.4, with n=40. (a) Give the test statistic and the p-value.Round your answer for the test statistic to two decimal places and your answer for the p-value to three decimal places.test statistic = p-value =arrow_forward
- The time needed to find a parking space is normally distributed with a mean of 20 minutes and a standard deviation of 5.18 minutes. 90% of the time, it takes less than how many minutes to find a parking space?arrow_forwardA random sample of size 10 yielded roughly "mound-shaped" data with a sample mean of 63.5 and a sample variance of 60.8. Let (L, OU) be the interval estimate that contains the population mean with 95% probability. Find the width of the interval. That is, find 0 – 0₁. 4.52 5.49 5.58 5.70 9.04 10.99 11.16 11.40 none of the other answers give the correct widtharrow_forwardIn a test of H0: μ = 14 against HA: μ < 14, the sample data with sample size 25 from a normal distribution yielded a test statistic Tobs = -3.15. Bracket the p-value for the test.arrow_forward
arrow_back_ios
arrow_forward_ios
Recommended textbooks for you
- MATLAB: An Introduction with ApplicationsStatisticsISBN:9781119256830Author:Amos GilatPublisher:John Wiley & Sons Inc
 Probability and Statistics for Engineering and th...StatisticsISBN:9781305251809Author:Jay L. DevorePublisher:Cengage Learning
 Statistics for The Behavioral Sciences (MindTap C...StatisticsISBN:9781305504912Author:Frederick J Gravetter, Larry B. WallnauPublisher:Cengage Learning
  Elementary Statistics: Picturing the World (7th E...StatisticsISBN:9780134683416Author:Ron Larson, Betsy FarberPublisher:PEARSON
 The Basic Practice of StatisticsStatisticsISBN:9781319042578Author:David S. Moore, William I. Notz, Michael A. FlignerPublisher:W. H. Freeman
 Introduction to the Practice of StatisticsStatisticsISBN:9781319013387Author:David S. Moore, George P. McCabe, Bruce A. CraigPublisher:W. H. Freeman
MATLAB: An Introduction with Applications
Statistics
ISBN:9781119256830
Author:Amos Gilat
Publisher:John Wiley & Sons Inc
Probability and Statistics for Engineering and th...
Statistics
ISBN:9781305251809
Author:Jay L. Devore
Publisher:Cengage Learning
Statistics for The Behavioral Sciences (MindTap C...
Statistics
ISBN:9781305504912
Author:Frederick J Gravetter, Larry B. Wallnau
Publisher:Cengage Learning
Elementary Statistics: Picturing the World (7th E...
Statistics
ISBN:9780134683416
Author:Ron Larson, Betsy Farber
Publisher:PEARSON
The Basic Practice of Statistics
Statistics
ISBN:9781319042578
Author:David S. Moore, William I. Notz, Michael A. Fligner
Publisher:W. H. Freeman
Introduction to the Practice of Statistics
Statistics
ISBN:9781319013387
Author:David S. Moore, George P. McCabe, Bruce A. Craig
Publisher:W. H. Freeman