
MATLAB: An Introduction with Applications
6th Edition
ISBN: 9781119256830
Author: Amos Gilat
Publisher: John Wiley & Sons Inc
expand_more
expand_more
format_list_bulleted
Related questions
Question
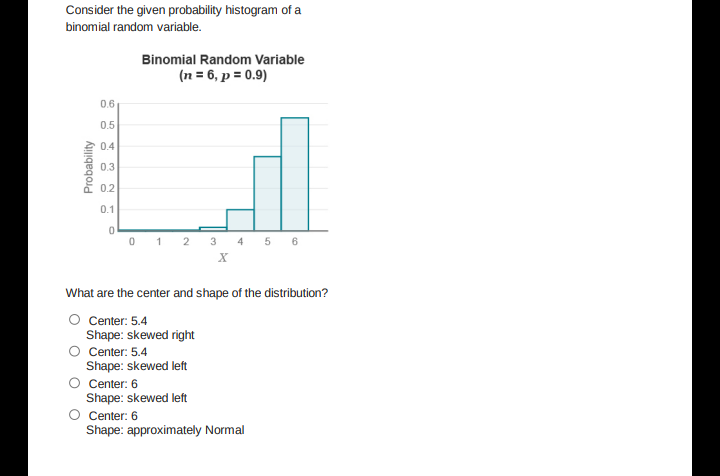

Transcribed Image Text:Consider the given probability histogram of a
binomial random variable.
Binomial Random Variable
(n = 6, p = 0.9)
0.6
0.5
0.4
0.3
0.2
0.1
0 1 2 3 4 5 6
What are the center and shape of the distribution?
Center: 5.4
Shape: skewed right
Center: 5.4
Shape: skewed left
Center: 6
Shape: skewed left
Center: 6
Shape: approximately Normal
Probability
Expert Solution
This question has been solved!
Explore an expertly crafted, step-by-step solution for a thorough understanding of key concepts.

This is a popular solution

Trending nowThis is a popular solution!

Step by stepSolved in 2 steps with 2 images

Knowledge Booster

Similar questions
- Talent Corp is a HR-consulting firm. The number of new clients that they have obtained each month has ranged from 0 to 6. The number of new clients has the probability distribution that is shown below. Number of New Clients Probability 0 0.05 1 0.10 2 0.15 3 0.30 4 0.25 5 0.10 6 0.05 Compute the expected number of new clients each month. Compute the variance and standard deviation for the expected number of new clients. What is the probability that there will be 2 or fewer clients next month?arrow_forwardTire pressure monitoring systems (TPMS) warn the driver when the tire pressure of the vehicle is 28% below the target pressure. Suppose the target tire pressure of a certain car is 28 psi (pounds per square inch.) (a) At what psi will the TPMS trigger a warning for this car? (Round your answer to 2 decimal place.) When the tire pressure is (Click to select) psi. (b) Suppose tire pressure is a normally distributed random variable with a standard deviation equal to 3 psi. If the car's average tire pressure is on target, what is the probability that the TPMS will trigger a warning? (Round your answer to 4 decimal places.) Probability (c) The manufacturer's recommended correct inflation range is 26 psi to 30 psi. Assume the tires' average psi is on target. If a tire on the car is inspected at random, what is the probability that the tire's inflation is within the recommended range? (Round your intermediate calculations and final answer to 4 decimal places.) Probability 18 of 19 Next > Prev…arrow_forwardOxygen demand is a term biologists use to describe the oxygen needed by fish and other aquatic organisms for survival. The Environmental Protection Agency conducted a study of a wetland area. In this wetland environment, the mean oxygen demand was μ = 9.2 mg/L with 95% of the data ranging from 5.4 mg/L to 13.0 mg/L. Let x be a random variable that represents oxygen demand in this wetland environment. Assume xhas a probability distribution that is approximately normal. (a) Use the 95% data range to estimate the standard deviation for oxygen demand. (b) An oxygen demand below 8 indicates that some organisms in the wetland environment may be dying. What is the probability that the oxygen demand will fall below 8 mg/L?(Round your answer to four decimal places.) (c) A high oxygen demand can also indicate trouble. An oxygen demand above 12 may indicate an overabundance of organisms that endanger some types of plant life. What is the probability that the oxygen demand will exceed 12…arrow_forward
- Salaries for teachers in a particular elementary school district are normally distributed with a mean of $41,000 and a standard deviation of $6,200. We randomly survey ten teachers from that district. O Part (a) In words, define the random variable X. O the salary of an elementary school teacher in the district O the number of teachers in the district O the number of teachers in an elementary school in the district O the number of elementary schools in the district O Part (b) O Part (c) O Part (d) Give the distribution of EX. (Round your answers to two decimal places.) EX - NV 41000 6200 O Part (e) Find the probability that the teachers earn total of over $400,000. (Round your answer to four decimal places.) O Part (f) Find the 90th percentile for an individual teacher's salary. (Round your answer to the nearest whole number.) O Part (g) Find the 90th percentile for the sum of ten teachers' salary. (Round your answer to the nearest whole number.) O Part (h) If we surveyed 70 teachers…arrow_forwardWhat is the significance of the mean of a probability distribution? Choose the correct answer below. OA. It gives information about how the outcomes vary. OB. It is the expected value of a discrete random variable. OC. It can never be negative. OD. It represents the most likely possible outcome. Carrow_forwardprobabilityarrow_forward
arrow_back_ios
arrow_forward_ios
Recommended textbooks for you
- MATLAB: An Introduction with ApplicationsStatisticsISBN:9781119256830Author:Amos GilatPublisher:John Wiley & Sons Inc
 Probability and Statistics for Engineering and th...StatisticsISBN:9781305251809Author:Jay L. DevorePublisher:Cengage Learning
 Statistics for The Behavioral Sciences (MindTap C...StatisticsISBN:9781305504912Author:Frederick J Gravetter, Larry B. WallnauPublisher:Cengage Learning
  Elementary Statistics: Picturing the World (7th E...StatisticsISBN:9780134683416Author:Ron Larson, Betsy FarberPublisher:PEARSON
 The Basic Practice of StatisticsStatisticsISBN:9781319042578Author:David S. Moore, William I. Notz, Michael A. FlignerPublisher:W. H. Freeman
 Introduction to the Practice of StatisticsStatisticsISBN:9781319013387Author:David S. Moore, George P. McCabe, Bruce A. CraigPublisher:W. H. Freeman
MATLAB: An Introduction with Applications
Statistics
ISBN:9781119256830
Author:Amos Gilat
Publisher:John Wiley & Sons Inc
Probability and Statistics for Engineering and th...
Statistics
ISBN:9781305251809
Author:Jay L. Devore
Publisher:Cengage Learning
Statistics for The Behavioral Sciences (MindTap C...
Statistics
ISBN:9781305504912
Author:Frederick J Gravetter, Larry B. Wallnau
Publisher:Cengage Learning
Elementary Statistics: Picturing the World (7th E...
Statistics
ISBN:9780134683416
Author:Ron Larson, Betsy Farber
Publisher:PEARSON
The Basic Practice of Statistics
Statistics
ISBN:9781319042578
Author:David S. Moore, William I. Notz, Michael A. Fligner
Publisher:W. H. Freeman
Introduction to the Practice of Statistics
Statistics
ISBN:9781319013387
Author:David S. Moore, George P. McCabe, Bruce A. Craig
Publisher:W. H. Freeman