MATLAB: An Introduction with Applications
6th Edition
ISBN: 9781119256830
Author: Amos Gilat
Publisher: John Wiley & Sons Inc
expand_more
expand_more
format_list_bulleted
Question

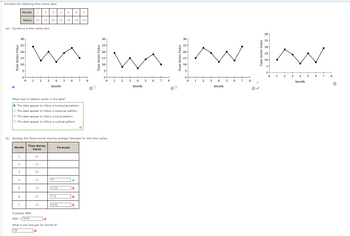
Transcribed Image Text:Consider the following time series data.
Month 1 2 3
Value 24 13 20
(a) Construct a time series plot.
30
25-
1
20
15
2
Month
4
What type of pattern exists in the data?
The data appear to follow a horizontal pattern.
O The data appear to follow a seasonal pattern.
3
5
O The data appear to follow a trend pattern.
O The data appear to follow a cyclical pattern.
5
7
6
6
(b) Develop the three-month moving average forecasts for this time series.
Time Series
Value
30
25
25
20
20-
15
mimi ww
15-
10+
10-
5
0
0 1 2 3 4 5 6 7 8
Month
Compute MSE.
MSE 18.09
24
13
20
12
19
23
15
5
19
17.25
17.6
12 19 23 15
Forecast
18.50
6
1x
What is the forecast for month 8?
126
x
7
x
x
x
30
0
0 1 2
3 4 5
Month
7
8
30
25
20-
15
10
5
0 1
2
3 4 5
Month
6
7
8
O
O✓
0
0
1
3 4
Month
5 6
+
7
8
0

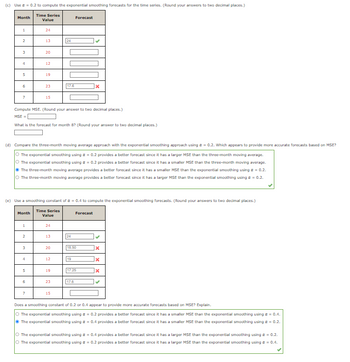
Transcribed Image Text:(c) Use a = 0.2 to compute the exponential smoothing forecasts for the time series. (Round your answers to two decimal places.)
Time Series
Value
Month
1
2
لیا
4
5
6
7
Month
1
2
24
3
13.
4
20
5
12
6
19
Compute MSE. (Round your answer to two decimal places.)
MSE=
What is the forecast for month 8? (Round your answer to two decimal places.)
23
(d) Compare the three-month moving average approach with the exponential smoothing approach using a = 0.2. Which appears to provide more accurate forecasts based on MSE?
O The exponential smoothing using a = 0.2 provides a better forecast since it has a larger MSE than the three-month moving average.
O The exponential smoothing using a = 0.2 provides a better forecast since it has a smaller MSE than the three-month moving average.
15
The three-month moving average provides a better forecast since it has a smaller MSE than the exponential smoothing using a = 0.2.
O The three-month moving average provides a better forecast since it has a larger MSE than the exponential smoothing using a = 0.2.
(e) Use a smoothing constant of a = 0.4 to compute the exponential smoothing forecasts. (Round your answers to two decimal places.)
Time Series
Value
24
13.
20
24
12
17.6
19
23
15
Forecast
24
19
x
18.50
Forecast
17.6
17.25
x
X
X
Does a smoothing constant of 0.2 or 0.4 appear to provide more accurate forecasts based on MSE? Explain.
O The exponential smoothing using a = 0.2 provides a better forecast since it has a smaller MSE than the exponential smoothing using a = 0.4.
The exponential smoothing using a = 0.4 provides a better forecast since it has a smaller MSE than the exponential smoothing using α = 0.2.
O The exponential smoothing using a = 0.4 provides a better forecast since it has a larger MSE than the exponential smoothing using α = 0.2.
O The exponential smoothing using a = 0.2 provides a better forecast since it has a larger MSE than the exponential smoothing using a = 0.4.
Expert Solution
This question has been solved!
Explore an expertly crafted, step-by-step solution for a thorough understanding of key concepts.
This is a popular solution
Trending nowThis is a popular solution!
Step by stepSolved in 6 steps with 11 images

Knowledge Booster
Similar questions
- Ta Mete a lan Mlaa Ma t Cun hane 15 tradeshare This graph is an example for a. time-series data b. panel-data c. experimental data d. cross-sectional dataarrow_forwardThe values of Alabama building contracts (in millions of dollars) for a 12-month period follow. (a) Construct a time series plot. 400 350 300 250 200+ O 1 2 3 4 Month 5 6 What type of pattern exists in the data? 7 240 340 220 260 280 310 8 9 150- 100 The data appear to follow a seasonal pattern. The data appear to follow a cyclical pattern. The data appear to follow a trend pattern. O The data appear to follow a horizontal pattern. 10 50 0 11 12 01 2 400 350 300 250 200- 150 100 50 0 0 1 2 3 4 5 34 5 6 7 8 9 10 11 12 13 Month Time Series Value (in $ millions) 240 340 (b) Compare the three-month moving average forecast with the exponential smoothing forecast using a = 0.2. (Round your answers to two decimal places.) 220 260 280 310 210 320 250 6 320 7 Month 230 220 210 320 250 320 230 220 de 8 9 10 11 12 13 r 3-Month Moving Average Forecast (in $ millions) 400 350+ 300 250 200+ 150- 100+ 50+ 0 01010101000 400 T 350 300 0 1 2 3 4 250+ 200+ 150+ 100+ α = 0.2 Forecast (in $ millions) 50…arrow_forwardFind text or tools Use the information provided below to answer questions 24-25. INFORMATION The times series graph below shows information about the quarterly number of tourists from the European Union (EU) to vh Africa over the 2021-2023 period. The underlying trend line indicated by the dotted line is defined by the equation, y 703x-176 577. Time ones graph of quarterly number of tourists for EU to South 40000 REANDDIC 300000 2240 2010 200000 150000 18390 1000 0 2 --T Arica (2021-2023) 12920 30000 2013 8 10 1999 18 QUESTION 24 (4 marks) Using data from the graph, estimate the mean seasonal variation (or average seasonal effect) for quarter 4 (Q4) and use it to predict the number of tourists from the EU expected to visit South Africa in quarter 4 of 2024. A. The mean seasonal variation is -25 000; the number of tourists from the EU expected to visit South Africa in quarter 4 of 2024 is 322 825. B. The mean seasonal variation is 25 000, the number of tourists from the EU expected to…arrow_forward
- Section 2.1, question 9arrow_forwardhis question refers to excavations at a national monument. One question the archaeologists asked was: Is raw material used by prehistoric Indians for stone tool manufacture independent of the archaeological excavation site? Two different excavation sites gave the information in the following table. Use a chi-square test with 5% level of significance to test the claim that raw material used for construction of stone tools and excavation site are independent. Excavation Site Material Site A Site B Row Total Basalt 756 559 1315 Obsidian 92 103 195 Pedernal chert 514 521 1035 Other 88 91 179 Column Total 1450 1274 2724 (a) What is the level of significance? (b) Find the value of the chi-square statistic for the sample. (Round the expected frequencies to at least three decimal places. Round the test statistic to three decimal places.)arrow_forwardwhich trend and would it be negative or postive or neitherarrow_forward
arrow_back_ios
arrow_forward_ios
Recommended textbooks for you
 MATLAB: An Introduction with ApplicationsStatisticsISBN:9781119256830Author:Amos GilatPublisher:John Wiley & Sons Inc
 Probability and Statistics for Engineering and th...StatisticsISBN:9781305251809Author:Jay L. DevorePublisher:Cengage Learning
 Statistics for The Behavioral Sciences (MindTap C...StatisticsISBN:9781305504912Author:Frederick J Gravetter, Larry B. WallnauPublisher:Cengage Learning
 Elementary Statistics: Picturing the World (7th E...StatisticsISBN:9780134683416Author:Ron Larson, Betsy FarberPublisher:PEARSON
 The Basic Practice of StatisticsStatisticsISBN:9781319042578Author:David S. Moore, William I. Notz, Michael A. FlignerPublisher:W. H. Freeman
 Introduction to the Practice of StatisticsStatisticsISBN:9781319013387Author:David S. Moore, George P. McCabe, Bruce A. CraigPublisher:W. H. Freeman

MATLAB: An Introduction with Applications
Statistics
ISBN:9781119256830
Author:Amos Gilat
Publisher:John Wiley & Sons Inc

Probability and Statistics for Engineering and th...
Statistics
ISBN:9781305251809
Author:Jay L. Devore
Publisher:Cengage Learning

Statistics for The Behavioral Sciences (MindTap C...
Statistics
ISBN:9781305504912
Author:Frederick J Gravetter, Larry B. Wallnau
Publisher:Cengage Learning

Elementary Statistics: Picturing the World (7th E...
Statistics
ISBN:9780134683416
Author:Ron Larson, Betsy Farber
Publisher:PEARSON

The Basic Practice of Statistics
Statistics
ISBN:9781319042578
Author:David S. Moore, William I. Notz, Michael A. Fligner
Publisher:W. H. Freeman

Introduction to the Practice of Statistics
Statistics
ISBN:9781319013387
Author:David S. Moore, George P. McCabe, Bruce A. Craig
Publisher:W. H. Freeman