MATLAB: An Introduction with Applications
6th Edition
ISBN: 9781119256830
Author: Amos Gilat
Publisher: John Wiley & Sons Inc
expand_more
expand_more
format_list_bulleted
Question

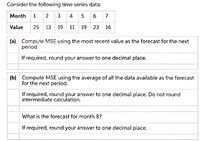
Transcribed Image Text:Consider the following time series data:
Month 1 2 3 4 5 6 7
Value
25 13 19 11 19 23 16
(a) Compute MSE using the most recent value as the forecast for the next
period.
If required, round your answer to one decimal place.
(b) Compute MSE using the average of all the data available as the forecast
for the next period.
If required, round your answer to one decimal place. Do not round
intermediate calculation.
What is the forecast for month 8?
If required, round your answer to one decimal place.
Expert Solution
This question has been solved!
Explore an expertly crafted, step-by-step solution for a thorough understanding of key concepts.
This is a popular solution
Trending nowThis is a popular solution!
Step by stepSolved in 3 steps with 2 images

Knowledge Booster
Similar questions
- Consider the following time series data. Week 1 2 3 4 5 6 Value 19 14 17 12 18 14 Using the naive method (most recent value) as the forecast for the next week, compute the following measures of forecast accuracy. Round the intermediate calculations to two decimal places. Mean absolute error (to 1 decimal). Mean squared error (to 1 decimal). Mean absolute percentage error (to 2 decimals). % What is the forecast for week 7 (to the nearest whole number)?arrow_forwardsection 5.4 Step 1 of 2 : Calculate the population mean for the shelf-life. Round your answer to two decimal places, if necessary. Step 2 of 2 : Calculate the population standard deviation for the shelf-life. Round your answer to two decimal places, if necessary.arrow_forwardQUESTION 17 Craig interviewed several waiters and waitresses and asked them to estimate their annual income from waiting tables. He recorded the values in the Five Number Summary below, and found one outlier of $14,500. The next smallest value in the dataset was $18,000. Min: $14,500 Q1: $18,900 Med: $20,300 Q3: $21,700 Max: $25,100 Make a boxplot for these values by hand and attach your work as a pdf, jpg, or png. A suggested way to set up your graphing space is as follows: $28,000 $27,000 $26,000 $25,000 $24,000 $23,000 $22,000 $21,000 $20,000 $19,000 $18,000 $17,000 $16,000 $15,000 $14,000arrow_forward
- Following shows the numbers of Amazon Prime members in the millions, each quarter from 2016 to 2021. Quarter 2016 2017 2018 2019 2020 2021 1 26 36 48 62 81 98 2 27 37 50 65 83 103 3 29 40 53 69 86 109 4 33 44 57 74 93 117 Construct a line chart using the data. Describe the relationship between the time and number of subscribers.arrow_forwardThe data for this problem are the air freight shipments (in ton-miles) each month (beginning in January for one year) in the U. S. for 10 years. The following is a time series plot of this data. What are the most important features of this plot? Ton-miles 3000- 2500- 2000- 1500- 1000- 1 Time Series Plot of Ton-miles ܚ ܪܘܐܐܐ ܘ ܚܐ ܀ 12 24 36 48 60 Index 72 84 96 108 120arrow_forwardI need some help with the following problems on excel.arrow_forward
arrow_back_ios
arrow_forward_ios
Recommended textbooks for you
 MATLAB: An Introduction with ApplicationsStatisticsISBN:9781119256830Author:Amos GilatPublisher:John Wiley & Sons Inc
 Probability and Statistics for Engineering and th...StatisticsISBN:9781305251809Author:Jay L. DevorePublisher:Cengage Learning
 Statistics for The Behavioral Sciences (MindTap C...StatisticsISBN:9781305504912Author:Frederick J Gravetter, Larry B. WallnauPublisher:Cengage Learning
 Elementary Statistics: Picturing the World (7th E...StatisticsISBN:9780134683416Author:Ron Larson, Betsy FarberPublisher:PEARSON
 The Basic Practice of StatisticsStatisticsISBN:9781319042578Author:David S. Moore, William I. Notz, Michael A. FlignerPublisher:W. H. Freeman
 Introduction to the Practice of StatisticsStatisticsISBN:9781319013387Author:David S. Moore, George P. McCabe, Bruce A. CraigPublisher:W. H. Freeman

MATLAB: An Introduction with Applications
Statistics
ISBN:9781119256830
Author:Amos Gilat
Publisher:John Wiley & Sons Inc

Probability and Statistics for Engineering and th...
Statistics
ISBN:9781305251809
Author:Jay L. Devore
Publisher:Cengage Learning

Statistics for The Behavioral Sciences (MindTap C...
Statistics
ISBN:9781305504912
Author:Frederick J Gravetter, Larry B. Wallnau
Publisher:Cengage Learning

Elementary Statistics: Picturing the World (7th E...
Statistics
ISBN:9780134683416
Author:Ron Larson, Betsy Farber
Publisher:PEARSON

The Basic Practice of Statistics
Statistics
ISBN:9781319042578
Author:David S. Moore, William I. Notz, Michael A. Fligner
Publisher:W. H. Freeman

Introduction to the Practice of Statistics
Statistics
ISBN:9781319013387
Author:David S. Moore, George P. McCabe, Bruce A. Craig
Publisher:W. H. Freeman