
Structural Analysis
6th Edition
ISBN: 9781337630931
Author: KASSIMALI, Aslam.
Publisher: Cengage,
expand_more
expand_more
format_list_bulleted
Related questions
Question
Consider the following spot speed data, which were collected from the location of expressways operating under free flow conditions:
a. Draw the frequency curve and cumulative frequency for this data.
b. Find and identify on the curve: average speed, modud speed, pace, percent of vehicles in pace.
c. Calculate the mean and standard deviation of the velocity distribution.
d. What are the confidence bounds in the true mean velocity estimate of the underlying distribution with a 95% confidence level? With a 99.7% confidence level?
e. Based on the results of this study, a second study should be conducted to achieve a tolerance of ±1.5 mi/hour with a 95% confidence level. What is the required sample size?
f. Can this data deserve to be declared as normal?
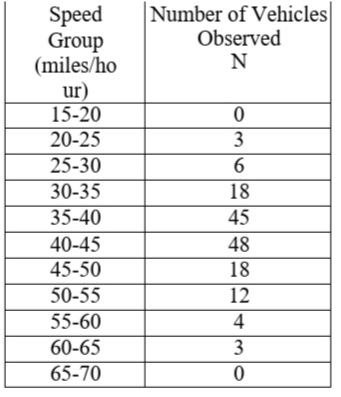

Transcribed Image Text:Speed
Group
(miles/ho
ur)
15-20
Number of Vehicles
Observed
N
20-25
3
25-30
30-35
35-40
18
45
40-45
48
45-50
18
50-55
12
55-60
4
60-65
3
65-70
Expert Solution
This question has been solved!
Explore an expertly crafted, step-by-step solution for a thorough understanding of key concepts.

Step by stepSolved in 5 steps with 5 images

Knowledge Booster

Similar questions
- Q4 / The data from moving observer methods as shown in the table. Column 1 gives the sample number, column 2 gives the number of vehicles moving against the stream, column 3 gives the number of vehicles that had overtaken the test vehicle, and last column gives the number of vehicles overtaken by the test vehicle. Find the flowrate, density and mean speed. Also, plot the fundamental diagrams of traffic flow. 2 3 4 No. Sample 1 107 10 74 113 25 41 3 30 15 4 79 18 9.arrow_forwardRoad and traffic engineeringarrow_forwardIn the plot of cumulative vehicle arrivals and cumulative vehicle departure curves (y-axis) vs. time (x-axis), the queue disappears when: Group of answer choices The cumulative arrival = cumulative departure The cumulative departure = 0 The cumulative arrival = 0 The departure rate (or service rate) > arrival ratearrow_forward
arrow_back_ios
arrow_forward_ios
Recommended textbooks for you
 Structural Analysis (10th Edition)Civil EngineeringISBN:9780134610672Author:Russell C. HibbelerPublisher:PEARSON
 Principles of Foundation Engineering (MindTap Cou...Civil EngineeringISBN:9781337705028Author:Braja M. Das, Nagaratnam SivakuganPublisher:Cengage Learning
 Fundamentals of Structural AnalysisCivil EngineeringISBN:9780073398006Author:Kenneth M. Leet Emeritus, Chia-Ming Uang, Joel LanningPublisher:McGraw-Hill Education
 Traffic and Highway EngineeringCivil EngineeringISBN:9781305156241Author:Garber, Nicholas J.Publisher:Cengage Learning
Structural Analysis (10th Edition)
Civil Engineering
ISBN:9780134610672
Author:Russell C. Hibbeler
Publisher:PEARSON
Principles of Foundation Engineering (MindTap Cou...
Civil Engineering
ISBN:9781337705028
Author:Braja M. Das, Nagaratnam Sivakugan
Publisher:Cengage Learning
Fundamentals of Structural Analysis
Civil Engineering
ISBN:9780073398006
Author:Kenneth M. Leet Emeritus, Chia-Ming Uang, Joel Lanning
Publisher:McGraw-Hill Education
Traffic and Highway Engineering
Civil Engineering
ISBN:9781305156241
Author:Garber, Nicholas J.
Publisher:Cengage Learning