Structural Analysis
6th Edition
ISBN: 9781337630931
Author: KASSIMALI, Aslam.
Publisher: Cengage,
expand_more
expand_more
format_list_bulleted
Question
thumb_up100%

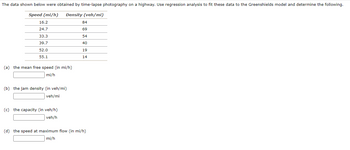
Transcribed Image Text:The data shown below were obtained by time-lapse photography on a highway. Use regression analysis to fit these data to the Greenshields model and determine the following.
Speed (mi/h) Density (veh/mi)
84
16.2
24.7
69
33.3
54
39.7
40
52.0
19
55.1
14
(a) the mean free speed (in mi/h)
mi/h
(b) the jam density (in veh/mi)
veh/mi
(c) the capacity (in veh/h)
veh/h
(d) the speed at maximum flow (in mi/h)
mi/h
Expert Solution
This question has been solved!
Explore an expertly crafted, step-by-step solution for a thorough understanding of key concepts.
This is a popular solution
Trending nowThis is a popular solution!
Step by stepSolved in 2 steps with 2 images

Knowledge Booster
Similar questions
- Assuming that the expression: u = ue i, can be used to describe the speed-density relationship of a highway, determine the capacity of the highway from the data below using regression analysis. k (veh/mi) u, (mi/h) 43 50 38.4 33.8 53.2 42.3 31 Under what flow conditions is the above model valid?arrow_forwardRoad and traffic engineeringarrow_forwardNote:hand written solution should be avoided.arrow_forward
- Given a freeway flow study at a certain highway. The speed- density relationship is described in the givenequation or relationship: V s = 58- 0.40k Determine the following:a. Free-flow speed and jam densityb. Derive the equation describing flow and speed.c. Derive the equation describing flow and density.d. Determine the capacity of highwayarrow_forward4. The statistical data of an urban spot speed study is given below. A set of 130 observations of spot speeds made by timing vehicles through a "Trap" of 88ft. The stopwatch was used to obtain data. The stopwatch data are grouped into 0.2 sec. Classes. The first column of the table shows the midpoint of each group. The second column of the table shows the frequency of the observations. Compute the following statistical values. a) The speed of each time class in mph (show it in the third column) b) The cumulative percent of vehicles traveling at or below indicated speed shown in the third column in mph (show it in the forth column) c) Mean or average speed (time-mean speed), median, mode, standard deviation, standard error of the mean, average time, space-mean speed, variance, 15%, and 85% speed. d) Plot the cumulative percentage, and show the statistical values of item (c) on the graph. e) Plot the frequency distribution curve and show the statistical values on the graph.arrow_forward
arrow_back_ios
arrow_forward_ios
Recommended textbooks for you

 Structural Analysis (10th Edition)Civil EngineeringISBN:9780134610672Author:Russell C. HibbelerPublisher:PEARSON
 Principles of Foundation Engineering (MindTap Cou...Civil EngineeringISBN:9781337705028Author:Braja M. Das, Nagaratnam SivakuganPublisher:Cengage Learning
 Fundamentals of Structural AnalysisCivil EngineeringISBN:9780073398006Author:Kenneth M. Leet Emeritus, Chia-Ming Uang, Joel LanningPublisher:McGraw-Hill Education
 Traffic and Highway EngineeringCivil EngineeringISBN:9781305156241Author:Garber, Nicholas J.Publisher:Cengage Learning


Structural Analysis (10th Edition)
Civil Engineering
ISBN:9780134610672
Author:Russell C. Hibbeler
Publisher:PEARSON

Principles of Foundation Engineering (MindTap Cou...
Civil Engineering
ISBN:9781337705028
Author:Braja M. Das, Nagaratnam Sivakugan
Publisher:Cengage Learning

Fundamentals of Structural Analysis
Civil Engineering
ISBN:9780073398006
Author:Kenneth M. Leet Emeritus, Chia-Ming Uang, Joel Lanning
Publisher:McGraw-Hill Education


Traffic and Highway Engineering
Civil Engineering
ISBN:9781305156241
Author:Garber, Nicholas J.
Publisher:Cengage Learning