
MATLAB: An Introduction with Applications
6th Edition
ISBN: 9781119256830
Author: Amos Gilat
Publisher: John Wiley & Sons Inc
expand_more
expand_more
format_list_bulleted
Related questions
Question
thumb_up100%
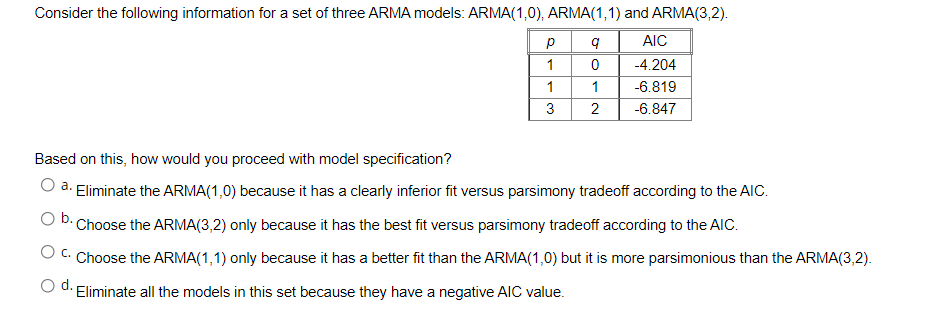

Transcribed Image Text:Consider the following information for a set of three ARMA models: ARMA(1,0), ARMA(1,1) and ARMA(3,2).
AIC
1
-4.204
1
-6.819
2
-6.847
Based on this, how would you proceed with model specification?
O a. Eliminate the ARMA(1,0) because it has a clearly inferior fit versus parsimony tradeoff according to the AIC.
Ob.
Choose the ARMA(3,2) only because it has the best fit versus parsimony tradeoff according to the AIC.
O C. Choose the ARMA(1,1) only because it has a better fit than the ARMA(1,0) but it is more parsimonious than the ARMA(3,2).
Od.
Eliminate all the models in this set because they have a negative AIC value.
3.
Expert Solution
This question has been solved!
Explore an expertly crafted, step-by-step solution for a thorough understanding of key concepts.

Step by stepSolved in 2 steps

Knowledge Booster

Similar questions
- 1) Malaria is a disease that destroys red blood cells (the parasite invades red blood cells, multiplies, and then infects more red blood cells). In a recent study (Kotepul, et al., 2015) looking at various blood counts, the authors found the following results. Results are in billion red blood cells / cubic mm. Note that I have deliberately modified these results (do not use R): n ̄y s Low infection 527 4.16 2.23 High infection 157 4.51 2.34 Is there a difference in red blood cell count?(Hint: please think about this before you just start working on the problem!)arrow_forwardPlz do (i) for mearrow_forwardThe raw data gathered on a university campus from a survey of art degree majors and their residency status were as follows: α11 = 67, α12 = 33, a13 = 22, a21 132, a22 = 78, A23 = 39, α31 = 31, a32 = 11, α33 = 4, α41 =74, a42 = 75, a43 - = 22 The following contingency table was created based on the above data, where you will need to calculate the grand total, the total for each row, and the total for each column on your own before answering the question that appears after the table. Digital Media Drawing/Painting Sculpture Studio Arts Total In-State Students 67 132 31 74 Out-of- State Students 33 78 11 75 International Students 22 39 4 22 Total Calculate the probability that someone is a studio arts major AND an In- State student. (For answers up to four decimal places, enter the number in the box below without rounding it. For answers that have more than four decimal values, round your answer to four decimal places).arrow_forward
- SO what would be the L, Lq, and Wq of this problem? Assuming we are trying to develop and sovle a waiting line system that can accomodate this increased leel of passenger traffic.arrow_forwardUsing all 1991 birth records in the computerized national birth certificate registry compiled by the National Center for Health Statistics (NCHS), statisticians Traci Clemons and Marcello Pagano found that the birth weights of babies in the United States are not symmetric ("Are babies normal?" The American Statistician, Nov 1999, 53:4). However, they also found that when infants born outside of the "typical" 37-43 weeks and infants born to mothers with a history of diabetes are excluded, the birth weights of the remaining infants do follow a Normal model with mean p = 3432 g and standard deviation o = 482 g. The following questions refer to infants born from 37 to 43 weeks whose mothers did not have a history of diabetes. %3D Compute the z-score of an infant who weighs 2189 g. (Round your answer to two decimal places.) Approximately what fraction of infants would you expect to have birth weights between 2760 g and 4230 g? (Express your answer as a decimal, not a percent, and round to…arrow_forwardThis is a multipart question 6.) Diesel Dave has modified his massive truck to combat global cooling, and to roll coal on his neighbor Environmentalist Ed. With each blast of diesel exhaust fumes, Diesel Dave releases sulfur dioxide in a giantblack cloud. Every morning as Diesel Dave is leaving home he rolls coal into Environmentalist Ed's yard. Not surprisingly, Environmentalist Ed is diligently collecting data on the air quality in his yard. Suppose Diesel Davereleases sulfur dioxide in a normally distributed manner with a mean of 2800 ppm and a standard deviation of 120 ppm. What is the probability that on a random morning he will release sulfur dioxide greater than 3000ppm? Suppose in order to sue Diesel Dave, Environmentalist Ed needs the daily average level of sulfur dioxide emissions to exceed 3000 ppm. However, he can choose to take his mean measurement over 2, 3, or 15 days. Which number of days would maximize Environmentalist Edís chances of suing Diesel Dave? (Hint: What…arrow_forward
- Select the correct text in the passage. Which word or phrase in the excerpt supports the meaning of the word deteriorating as “becoming worse over time”? excerpt from Exploring the Secrets of Marsh Happinessby NOAA Characterizing an “unhappy,” deteriorating tidal marsh is more complex because marshes can fall apart in many different ways. One finding contradicted a previous assumption: namely, that gains in marsh elevation and sediment indicate greater resilience. The authors say marshes with these characteristics performed inconsistently and often signaled the muddy mess that degrading marshes can become, not marsh health.arrow_forwardneed help with followingarrow_forward
arrow_back_ios
arrow_forward_ios
Recommended textbooks for you
- MATLAB: An Introduction with ApplicationsStatisticsISBN:9781119256830Author:Amos GilatPublisher:John Wiley & Sons Inc
 Probability and Statistics for Engineering and th...StatisticsISBN:9781305251809Author:Jay L. DevorePublisher:Cengage Learning
 Statistics for The Behavioral Sciences (MindTap C...StatisticsISBN:9781305504912Author:Frederick J Gravetter, Larry B. WallnauPublisher:Cengage Learning
  Elementary Statistics: Picturing the World (7th E...StatisticsISBN:9780134683416Author:Ron Larson, Betsy FarberPublisher:PEARSON
 The Basic Practice of StatisticsStatisticsISBN:9781319042578Author:David S. Moore, William I. Notz, Michael A. FlignerPublisher:W. H. Freeman
 Introduction to the Practice of StatisticsStatisticsISBN:9781319013387Author:David S. Moore, George P. McCabe, Bruce A. CraigPublisher:W. H. Freeman
MATLAB: An Introduction with Applications
Statistics
ISBN:9781119256830
Author:Amos Gilat
Publisher:John Wiley & Sons Inc
Probability and Statistics for Engineering and th...
Statistics
ISBN:9781305251809
Author:Jay L. Devore
Publisher:Cengage Learning
Statistics for The Behavioral Sciences (MindTap C...
Statistics
ISBN:9781305504912
Author:Frederick J Gravetter, Larry B. Wallnau
Publisher:Cengage Learning
Elementary Statistics: Picturing the World (7th E...
Statistics
ISBN:9780134683416
Author:Ron Larson, Betsy Farber
Publisher:PEARSON
The Basic Practice of Statistics
Statistics
ISBN:9781319042578
Author:David S. Moore, William I. Notz, Michael A. Fligner
Publisher:W. H. Freeman
Introduction to the Practice of Statistics
Statistics
ISBN:9781319013387
Author:David S. Moore, George P. McCabe, Bruce A. Craig
Publisher:W. H. Freeman