
MATLAB: An Introduction with Applications
6th Edition
ISBN: 9781119256830
Author: Amos Gilat
Publisher: John Wiley & Sons Inc
expand_more
expand_more
format_list_bulleted
Related questions
Concept explainers
Question
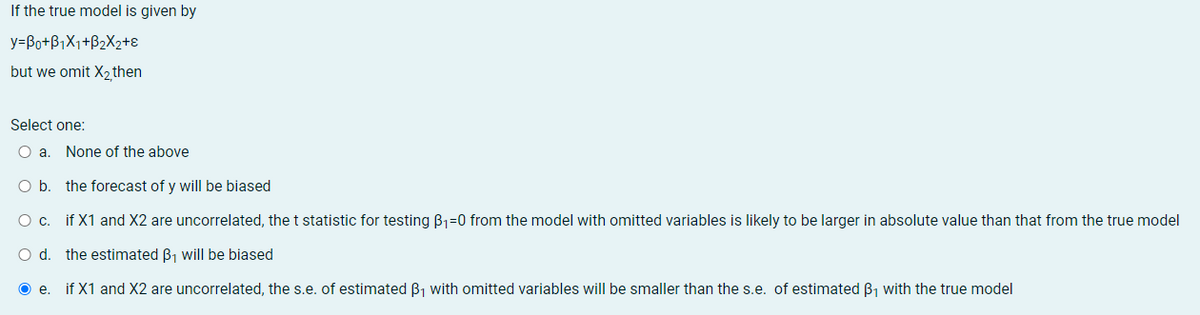

Transcribed Image Text:If the true model is given by
y=Bo+B1X1+B2X2+ɛ
but we omit X2 then
Select one:
Oa.
None of the above
O b. the forecast of y will be biased
O c. if X1 and X2 are uncorrelated, the t statistic for testing B1=0 from the model with omitted variables is likely to be larger in absolute value than that from the true model
O d. the estimated B1 will be biased
if X1 and X2 are uncorrelated, the s.e. of estimated B, with omitted variables will be smaller than the s.e. of estimated B, with the true model
Expert Solution
This question has been solved!
Explore an expertly crafted, step-by-step solution for a thorough understanding of key concepts.

Step by stepSolved in 3 steps

Knowledge Booster


Learn more about
Need a deep-dive on the concept behind this application? Look no further. Learn more about this topic, statistics and related others by exploring similar questions and additional content below.Similar questions
- A psychologist is concerned about the health of veterans returning from war. She examines 25 veterans and finds that 34% show signs of post-traumatic stress disorder. Later research reveals the truth to be that 11% of veterans show signs of post-traumatic stress disorder. Is 34% a statistic or a parameter? Parameter Statistic Not enough information to determinearrow_forwardA weight-loss program wants to test how well their program is working. The company selects a simple random sample of 51 individual that have been using their program for 15 months. For each individual person, the company records the individual's weight when they started the program 15 months ago as an x-value. The subject's current weight is recorded as a y-value. Therefore, a data point such as (205, 190) would be for a specific person and it would indicate that the individual started the program weighing 205 pounds and currently weighs 190 pounds. In other words, they lost 15 pounds. When the company performed a regression analysis, they found a correlation coefficient of r = 0.707. This clearly shows there is strong correlation, which got the company excited. However, when they showed their data to a statistics professor, the professor pointed out that correlation was not the right tool to show that their program was effective. Correlation will NOT show whether or not there is…arrow_forwardI need help with this assaigmentarrow_forward
- 116). With 77.4 and y 77.2, you You run a regression analysis on a bivariate set of data (n obtain the regression equation y -1.848z+56.533 0.092. You want to predict what value (on average) for the with a correlation coefficient of r= response variable will be obtained from a value of 180 as the explanatory variable. What is the predicted response value? %3D (Report answer accurate to one decimal place.)arrow_forwardI know the answer between choice I) and choice II) is: I) But why is it choice I)?arrow_forwardSHOW STEP BY STEP. plsarrow_forward
- The full question for the last question is written down below Fail/fail to reject H0. There is insufficient/sufficient evidence at the 10% level of significance to support the claim that there is a linear relationship between weight and number of hours slept.arrow_forwardQ1. A psychologist conducted a study on the relationship between introversion and shyness. The values are results for scales of introversion and shyness. High positive scores on each scale indicate high introversion or shyness; and high negative scores indicate low introversion or shyness. Data collected from 10 people as follows: Introversion 4 -7 -1 0 6 7 -4 -9 -5 8 Shyness 11 -7 -1 -3 0 7 -1 -8 -1 5 a) Compute the correlation coefficient relating introversion and shyness scores. b) Find the regression equation which predicts introversion from shyness. c) What introversion score would you predict from a shyness score of 7?arrow_forwardThis dataset of size n - 51 is for the 50 states and the District of Columbia in the United States. The variables are - year 2002 birth rate per 1000 females 15 to 17 years old and z- poverty rate (the percent of the state's population living in households with in- comes below the federally defined poverty level) i- 13.1 - 22.3 R- 51, Su - E(-2) - 914.7 S, - E( -2)( - 6) - 1, 256.2 Su - E(m - M) - 3, 249 SSE - E(w - - 1, 509.6 1. Find A. A and r. 2. Write the fitted linear regression model for ý, in terms of z, A, and A- For A and , use the values you obtained in problem 1. 3. Interpret the slope of the least squares line based on the context. 4. Find SST, SE and SSR. 5. Find R* and . 6. Complete a chart for ANOVA df MS pvalue Source Regression Error Total 7. Complete a chart for Parameter Estimates. t-value pvalue Parameter Intercept Slope Estimate S.e. 8. What is the residual e, for the observation (.) - (20.1,31.5)? 9. What is the conclusion for the test Ha : -0 vs Ho : +0 with a -…arrow_forward
arrow_back_ios
arrow_forward_ios
Recommended textbooks for you
- MATLAB: An Introduction with ApplicationsStatisticsISBN:9781119256830Author:Amos GilatPublisher:John Wiley & Sons Inc
 Probability and Statistics for Engineering and th...StatisticsISBN:9781305251809Author:Jay L. DevorePublisher:Cengage Learning
 Statistics for The Behavioral Sciences (MindTap C...StatisticsISBN:9781305504912Author:Frederick J Gravetter, Larry B. WallnauPublisher:Cengage Learning
  Elementary Statistics: Picturing the World (7th E...StatisticsISBN:9780134683416Author:Ron Larson, Betsy FarberPublisher:PEARSON
 The Basic Practice of StatisticsStatisticsISBN:9781319042578Author:David S. Moore, William I. Notz, Michael A. FlignerPublisher:W. H. Freeman
 Introduction to the Practice of StatisticsStatisticsISBN:9781319013387Author:David S. Moore, George P. McCabe, Bruce A. CraigPublisher:W. H. Freeman
MATLAB: An Introduction with Applications
Statistics
ISBN:9781119256830
Author:Amos Gilat
Publisher:John Wiley & Sons Inc
Probability and Statistics for Engineering and th...
Statistics
ISBN:9781305251809
Author:Jay L. Devore
Publisher:Cengage Learning
Statistics for The Behavioral Sciences (MindTap C...
Statistics
ISBN:9781305504912
Author:Frederick J Gravetter, Larry B. Wallnau
Publisher:Cengage Learning
Elementary Statistics: Picturing the World (7th E...
Statistics
ISBN:9780134683416
Author:Ron Larson, Betsy Farber
Publisher:PEARSON
The Basic Practice of Statistics
Statistics
ISBN:9781319042578
Author:David S. Moore, William I. Notz, Michael A. Fligner
Publisher:W. H. Freeman
Introduction to the Practice of Statistics
Statistics
ISBN:9781319013387
Author:David S. Moore, George P. McCabe, Bruce A. Craig
Publisher:W. H. Freeman