
MATLAB: An Introduction with Applications
6th Edition
ISBN: 9781119256830
Author: Amos Gilat
Publisher: John Wiley & Sons Inc
expand_more
expand_more
format_list_bulleted
Related questions
Question
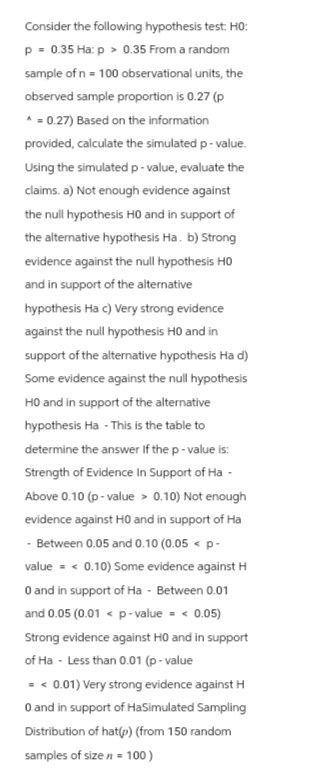

Transcribed Image Text:Consider the following hypothesis test: H0:
p = 0.35 Ha: p > 0.35 From a random
sample of n = 100 observational units, the
observed sample proportion is 0.27 (p
^ = 0.27) Based on the information
provided, calculate the simulated p-value.
Using the simulated p-value, evaluate the
claims. a) Not enough evidence against
the null hypothesis H0 and in support of
the alternative hypothesis Ha. b) Strong
evidence against the null hypothesis HO
and in support of the alternative
hypothesis Ha c) Very strong evidence
against the null hypothesis H0 and in
support of the alternative hypothesis Ha d)
Some evidence against the null hypothesis
HO and in support of the alternative
hypothesis Ha - This is the table to
determine the answer If the p-value is:
Strength of Evidence In Support of Ha-
Above 0.10 (p-value > 0.10) Not enough
evidence against H0 and in support of Ha
- Between 0.05 and 0.10 (0.05 < p-
value = < 0.10) Some evidence against H
0 and in support of Ha- Between 0.01
and 0.05 (0.01 < p-value = < 0.05)
Strong evidence against H0 and in support
of Ha - Less than 0.01 (p-value
= < 0.01) Very strong evidence against H
0 and in support of HaSimulated Sampling
Distribution of hat(p) (from 150 random
samples of size n = 100)

Transcribed Image Text:Simulated Sampling Distribution of p
(from 150 random samples of size n = 100)
DOC
0.10 0.15 0.20 0.25 0.30
OO
0000
ooo
300
0000
0.35 0.40 0.45
0
O
0.50 0.55
0.60
Expert Solution
This question has been solved!
Explore an expertly crafted, step-by-step solution for a thorough understanding of key concepts.

Step by stepSolved in 3 steps with 8 images

Knowledge Booster

Similar questions
- Test the claim that the mean GPA of Orange Coast students is smaller than the mean GPA of Coastline students at the 0.10 significance level. The null and alternative hypothesis would be: = Pc Ho: Ho µc Ho:po = po Ho: po pc Ho: po Pc H:Po Ho Od:I OTl > Orl: Ho: Po H Po. Ho Po Ho Po PC Ho Po S PC H1 Po The test is: two-tailed right-tailed left-tailed The sample consisted of 45 Orange Coast students, with a sample mean GPA of 2.24 and a standard deviation of 0.02, and 45 Coastline students, with a sample mean GPA of 2.25 and a standard deviation of 0.05. (to 2 decimals) The test statistic is: The p-value is: (to 2 decimals) Based on this we: O Reject the null hypothesis OFail to reject the null hypothesisarrow_forwardFor married couples, is there a significant difference in data usage between the two partners on their smartphones? A random sample of married couples were selected and their data usage over one particular month (chosen at random) was recorded. At the a = 0.10 level of significance, use the data given below to test the claim that there is no difference in data usage between partners. Let µp be the mean of the differences in data usage between partner 1 and partner 2 in each marriage. Assume that the differences have a normal distribution. (Round your results to three decimal places. Which would be correct hypotheses for this test? O Ho: HD = 0, H1: µp 0 O Ho: HD = 0, H1:µD > 0 GB of data used: Partner 1 Partner 2 1.74 3.98 2.53 2.42 4.03 2.42 1.16 3.22 1.93 1.5 3.12 1.43 2.93 2.41 2.76 3.05 2.48 3.28 3.56 2.76 1.33 4.38 3.37 3.47 1.71 2.64 3.81 2.28 Test Statistic:arrow_forwardTest the claim that the mean GPA of night students is smaller than 2.7 at the 0.05 significance level. The null and alternative hypothesis would be: Ho:p 2.7 Ho: µ 0.675 H:p 2.7 H1:p Next Question M hparrow_forward
- Test the clainm that the mean GPA of night students is significantly different than 2.5 at the 0.01 significance level. The null and alternative hypothesis would be: Ho:u > 2.5 Ho:p 0.625 Ho:p 0.625 H1:µ> 2.5 H :µ+ 2.5 H1:p 0.625 The test is: right-tailed left-tailed two-tailed Based on a sample of 55 people, the sample mean GPA was 2.46 with a standard deviation of 0.07 The p-value is: (to 2 decimals) Based on this we: O Fail to reject the null hypothesis O Reject the null hypothesisarrow_forwardTest the claim that the mean GPA of night students is smaller than 2.1 at the .005 significance level.The null and alternative hypothesis would be: H0:p=0.525H0:p=0.525H1:p<0.525H1:p<0.525 H0:p=0.525H0:p=0.525H1:p>0.525H1:p>0.525 H0:p=0.525H0:p=0.525H1:p≠0.525H1:p≠0.525 H0:μ=2.1H0:μ=2.1H1:μ≠2.1H1:μ≠2.1 H0:μ=2.1H0:μ=2.1H1:μ<2.1H1:μ<2.1 H0:μ=2.1H0:μ=2.1H1:μ>2.1H1:μ>2.1 The test is: left-tailed right-tailed two-tailed Based on a sample of 75 people, the sample mean GPA was 2.06 with a standard deviation of 0.07The test statistic is: (to 2 decimals)The critical value is: (to 2 decimals)Based on this we: Fail to reject the null hypothesis Reject the null hypothesisarrow_forwardDetermine the decision criterion for rejecting the null hypothesis in the given hypothesis test; i.e., describe the values of the test statistic that would result in rejection of the null hypothesis, suppose you wish to test the claim that Md, the mean value of the difference d for a population of unpaired data is greater than 0. Given samples n1=26 and n2=49 and a significance level of a=0.05, what criterion would be used for rejecting the null hypothesis?arrow_forward
- B. Identify the test statistic. z=___ C. Identify the P-value. P-value=___ D. What is the conclusion based on the hypothesis test? The P-value is (greater than/ less than) the significance level of α=0.05, so (reject/ fail to reject) the null hypothesis. There (suffiecient/ is not sufficient) evidence to warrant rejection of the claim that women and men have equal success in challenging calls. Test the claim by constructing an appropriate confidence interval. The 95% confidence interval is___<(p1-p2)<____. E. What is the conclusion based on the confidence interval? Because the confidence interval limits (include/ do not include) 0, there (does/ does not) appear to be a significant difference between the two proportions. There (is sufficient/ is not sufficient) evidence to warrant rejection of the claim that men and women have equal success in challenging calls. F. Based on the results, does it appear that men and women may have equal success in challenging…arrow_forward7) Consider the computer output shown below: One-Sample T:Y Test of mu =91 vs. not = 91 Variable Mean Std. Dev. SE Mean 95% CI 25 92.5805 (91.6160, ? ) 0.4675 3.38 0.002 (a) Fill in the missing values in the output. Can the null hypothesis be rejected at the 0.05 level? Why? (b) Is this a one-sided or two-sided test?arrow_forwardUtilizing the previous table: A sample of 25 cities have been classified as high or low on their homicide rates and on the number of handguns sold within the city limits. Was the null hypothesis rejected or accepted?arrow_forward
- The P-value for a hypothesis test is shown. Use the P-value to decide whether to reject. Ho when the level of significance is (a) a = 0.01, (b) a = 0.05, and (c) a=0.10. P=0.0411 (a) Do you reject or fail to reject Ho at the 0.01 level of significance? OA. Fail to reject Ho because the P-value, 0.0411, is greater than a = 0.01. OB. Fail to reject Ho because the P-value, 0.0411, is less than a =0.01. OC. Reject Ho because the P-value, 0.0411, is greater than a = 0.01. OD. Reject Ho because the P-value, 0.0411, is less than a = 0.01 (b) Do you reject or fail to reject Ho at the 0.05 level of significance? O A. Reject Ho because the P-value, 0.0411, is greater than a = 0.05. OB. Fail to reject Ho because the P-value, 0.0411, is less than a = 0.05. OC. Fail to reject Ho because the P-value, 0.0411, is greater than a = 0.05. O D. Reject Ho because the P-value, 0.0411, is less than a = 0.05. CECOarrow_forwardYou may need to use the appropriate appendix table or technology to answer this question. Consider the following hypothesis test. H0: p ≥ 0.85 Ha: p < 0.85 A sample of 160 items was selected. Compute the p-value and state your conclusion for each of the following sample results. Use ? = 0.05. (a) p = 0.78 (b) p = 0.82 (c) p = 0.80 (d) p = 0.88arrow_forwardAn experimenter flips a coin 100 times and gets 54 heads. Test the claim that the coin is fair against the two-sided alternative. (Null and Alternate Hypothesis and Test Statistic) A. Ho: p = 0.50; Ha: p < 0.50; z = 0.800 B. Ho: p = 0.50; Ha: p > 0.50; z = 0.800 C. Ho: p = 0.50; Ha: p > 0.50; z = 0.081 D. Ho: p = 0.50; Ha: p ≠ 0.50; z = 0.800 E. Ho: p = 0.50; Ha: p ≠ 0.50; z = 0.081 (p-value and conclusion) A. p = 0.540; FRHo (No sufficient evidence to reject the claim) B. p = 0.424; RHo (Sufficient evidence exists to reject the claim) C. p = 1.576; FRHo (No sufficient evidence to reject the claim) D. p = 0.424; FRHo (No sufficient evidence to reject the claim) E. p = 1.576; RHo (No sufficient evidence to reject the claim)arrow_forward
arrow_back_ios
SEE MORE QUESTIONS
arrow_forward_ios
Recommended textbooks for you
- MATLAB: An Introduction with ApplicationsStatisticsISBN:9781119256830Author:Amos GilatPublisher:John Wiley & Sons Inc
 Probability and Statistics for Engineering and th...StatisticsISBN:9781305251809Author:Jay L. DevorePublisher:Cengage Learning
 Statistics for The Behavioral Sciences (MindTap C...StatisticsISBN:9781305504912Author:Frederick J Gravetter, Larry B. WallnauPublisher:Cengage Learning
  Elementary Statistics: Picturing the World (7th E...StatisticsISBN:9780134683416Author:Ron Larson, Betsy FarberPublisher:PEARSON
 The Basic Practice of StatisticsStatisticsISBN:9781319042578Author:David S. Moore, William I. Notz, Michael A. FlignerPublisher:W. H. Freeman
 Introduction to the Practice of StatisticsStatisticsISBN:9781319013387Author:David S. Moore, George P. McCabe, Bruce A. CraigPublisher:W. H. Freeman
MATLAB: An Introduction with Applications
Statistics
ISBN:9781119256830
Author:Amos Gilat
Publisher:John Wiley & Sons Inc
Probability and Statistics for Engineering and th...
Statistics
ISBN:9781305251809
Author:Jay L. Devore
Publisher:Cengage Learning
Statistics for The Behavioral Sciences (MindTap C...
Statistics
ISBN:9781305504912
Author:Frederick J Gravetter, Larry B. Wallnau
Publisher:Cengage Learning
Elementary Statistics: Picturing the World (7th E...
Statistics
ISBN:9780134683416
Author:Ron Larson, Betsy Farber
Publisher:PEARSON
The Basic Practice of Statistics
Statistics
ISBN:9781319042578
Author:David S. Moore, William I. Notz, Michael A. Fligner
Publisher:W. H. Freeman
Introduction to the Practice of Statistics
Statistics
ISBN:9781319013387
Author:David S. Moore, George P. McCabe, Bruce A. Craig
Publisher:W. H. Freeman