MATLAB: An Introduction with Applications
6th Edition
ISBN: 9781119256830
Author: Amos Gilat
Publisher: John Wiley & Sons Inc
expand_more
expand_more
format_list_bulleted
Question

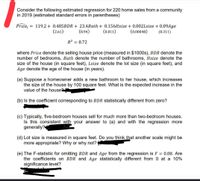
Transcribed Image Text:Consider the following estimated regression for 220 home sales from a community
in 2019 (estimated standard errors in parentheses)
Price = 119.2 + 0.485BDR + 23.4Bath + 0.156Hsize + 0.002Lsize + 0.09Age
(8.94)
(2.61)
(0.011)
(0.00048)
(0.311)
R2 = 0.72
where Price denote the selling house price (measured in $1000s), BDR denote the
number of bedrooms, Bath denote the number of bathrooms, Hsize denote the
size of the house (in square feet), Lsize denote the lot size (in square feet), and
Age denote the age of the house (in years).
(a) Suppose a homeowner adds a new bathroom to her house, which increases
the size of the house by 100 square feet. What is the expected increase in the
value of the house
(b) Is the coefficient corresponding to BDR statistically different from zero?
(c) Typically, five-bedroom houses sell for much more than two-bedroom houses.
Is this consistent with your answer to (a) and with the regression more
generally?
(d) Lot size is measured in square feet. Do you think that another scale might be
more appropriate? Why or why not?
(e) The F-statistic for omitting BDR and Age from the regression is F = 0.08. Are
the coefficients on BDR and Age statistically different from 0 at a 10%
significance level?
Expert Solution
This question has been solved!
Explore an expertly crafted, step-by-step solution for a thorough understanding of key concepts.
This is a popular solution
Trending nowThis is a popular solution!
Step by stepSolved in 4 steps with 5 images

Knowledge Booster
Similar questions
- Suppose the correlation between height and weight for adults is +0.40.What proportion (or percent) of the variability in weight can be explained by the relationship with height?arrow_forwardA researcher has conducted a study to investigate the relationship between how important a person thinks appearance is and how much they spend on clothes each month, The first variable was 'self- rating of the importance of appearance' measured on a ten point scale (where 1 = not important and 10 = extremely important). The second variable was 'amount of money spent on clothes each month' measured by asking people to estimate to the nearest five pounds how much they spent in a typical month, The results are in the table below: Participant Self-rating of Amount spent on of clothes month (Maloti) s (initials) importance each appearance HP 6 80 EP 8 120 SF 100 PR 110 MS 75 JP 36 AG 15 BF 50 (a) Describe how an appropriate descriptive statistic could be used with the data in this table. (b) Provide 2 reasons to justify your choice. (c) which inferential statistical (parametric and non-parametric) test would you use to analyze the data - give 2 reasons for your choices (d) Provide 2 reasons…arrow_forward** Based on the regression results, answer the following questions ** A sample of data is collected (from 1999 and 2000) concerning the compensation of the executives (compensation is measured in 1000’s of $’s) of a number of public companies along with other firm-specific data. The dependent variable is total compensation, CEOANN is a dummy variable =1 for an individual who is a CEO and =0 for individuals who are not CEO’s, EMPL is total employees, MKTVAL is the natural logarithm of the market value of the firm, EPSIN is earnings per share, YEAR is a dummy variable = 1 for the year 2000 and =0 for year 1999, and ASSETS is the natural logarithm of the total assets of the company. Based on the regression results, answer the following questions b) What is the estimated regression equation? c) What percentage of the variation in income in explained by the regressors? d) What is the standard error of the error term in the regression equation?arrow_forward
- Hello! Please analyse the table 3 and 4 in the image attached. the data is supposed to see if there is a relationship between the prevalence of obesity(table3) or life expectancy (table4) between males and females. thank you!arrow_forwardCalculate the test statistic. (X^2)Enter your answer rounded to three decimal places.arrow_forwardSuppose the following estimated regression equation was determined to predict salary based on years of experience. Estimated Salary = 29,136.63 +2257.51(Years of Experience) What is the estimated salary for an employee with 24 years of experience? Answer Keypad Keyboard Shortcuts Tablesarrow_forward
arrow_back_ios
arrow_forward_ios
Recommended textbooks for you
 MATLAB: An Introduction with ApplicationsStatisticsISBN:9781119256830Author:Amos GilatPublisher:John Wiley & Sons Inc
 Probability and Statistics for Engineering and th...StatisticsISBN:9781305251809Author:Jay L. DevorePublisher:Cengage Learning
 Statistics for The Behavioral Sciences (MindTap C...StatisticsISBN:9781305504912Author:Frederick J Gravetter, Larry B. WallnauPublisher:Cengage Learning
 Elementary Statistics: Picturing the World (7th E...StatisticsISBN:9780134683416Author:Ron Larson, Betsy FarberPublisher:PEARSON
 The Basic Practice of StatisticsStatisticsISBN:9781319042578Author:David S. Moore, William I. Notz, Michael A. FlignerPublisher:W. H. Freeman
 Introduction to the Practice of StatisticsStatisticsISBN:9781319013387Author:David S. Moore, George P. McCabe, Bruce A. CraigPublisher:W. H. Freeman

MATLAB: An Introduction with Applications
Statistics
ISBN:9781119256830
Author:Amos Gilat
Publisher:John Wiley & Sons Inc

Probability and Statistics for Engineering and th...
Statistics
ISBN:9781305251809
Author:Jay L. Devore
Publisher:Cengage Learning

Statistics for The Behavioral Sciences (MindTap C...
Statistics
ISBN:9781305504912
Author:Frederick J Gravetter, Larry B. Wallnau
Publisher:Cengage Learning

Elementary Statistics: Picturing the World (7th E...
Statistics
ISBN:9780134683416
Author:Ron Larson, Betsy Farber
Publisher:PEARSON

The Basic Practice of Statistics
Statistics
ISBN:9781319042578
Author:David S. Moore, William I. Notz, Michael A. Fligner
Publisher:W. H. Freeman

Introduction to the Practice of Statistics
Statistics
ISBN:9781319013387
Author:David S. Moore, George P. McCabe, Bruce A. Craig
Publisher:W. H. Freeman