
MATLAB: An Introduction with Applications
6th Edition
ISBN: 9781119256830
Author: Amos Gilat
Publisher: John Wiley & Sons Inc
expand_more
expand_more
format_list_bulleted
Related questions
Concept explainers
Topic Video
Question
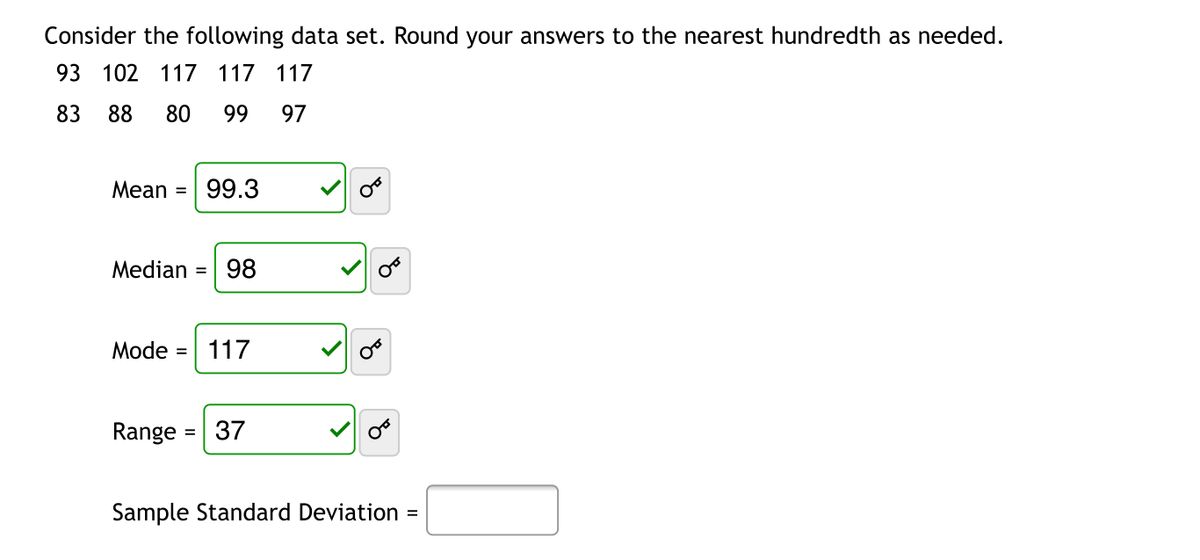

Transcribed Image Text:Consider the following data set. Round your answers to the nearest hundredth as needed.
93 102 117 117 117
83
88
80
99
97
Мean %3
99.3
Median =
98
Mode =
117
%D
Range
37
Sample Standard Deviation =
Expert Solution
This question has been solved!
Explore an expertly crafted, step-by-step solution for a thorough understanding of key concepts.

This is a popular solution

Trending nowThis is a popular solution!

Step by stepSolved in 2 steps with 1 images

Knowledge Booster


Learn more about
Need a deep-dive on the concept behind this application? Look no further. Learn more about this topic, statistics and related others by exploring similar questions and additional content below.Similar questions
- Please find the range, sample standard deviation, and interquartile range (IQR) of the following data set. 23 30 37 53 62 range sample standard deviation IQR = = 88 93 95 95 98 (Please enter an exact answer.) (Please show your answer to one decimal place.) (Please enter an exact answer.)arrow_forwardWe have provided simple data sets for you to practice the basics of finding a a. population mean. b. population standard deviation. 3, 5, 7arrow_forwardExam Grade 55 91 88 188 33 98 78 170 59 88 10 Given the above data set, what is the sample standard deviation of Study hours using a sample of the following students (Student Numbers: 1,3,5,9). Round to the nearest hundredth. Student # 11 2 3 14 5600 7 Study Hours 42 22 24 19 51 11 22 9 39arrow_forward
- The highway mileage (mpg) for a sample of 8 different models of a car company can be found below. Find the mean, median, mode, and standard deviation. Round to one decimal place as needed.20, 23, 26, 28, 30, 32, 33, 33arrow_forwardThe following refer to the following data set: 81.6 127.2 98.4 100.5 95.8 106.2 127.2 108 127.2 117.8 What is the arithmetic mean of this data set? mean = What is the median of this data set? median What is the mode of this data set? mode = %3Darrow_forwardThe highway mileage (mpg) for a sample of 8 different models of a car company can be found below. Find the mean, median, mode, and standard deviation. Round to one decimal place as needed. Use technology.20, 22, 26, 27, 29, 32, 33, 33Mean = Median = Mode = Standard Deviation =arrow_forward
- The highway mileage (mpg) for a sample of 8 different models of a car company can be found below. Find the mean, median, mode, and standard deviation. Round to one decimal place as needed. Use technology.19, 22, 26, 28, 29, 31, 35, 35Mean = Median = Mode = Standard Deviation =arrow_forwardFind the range and standard deviation of the following set of data. 168, 177, 163, 174, 167, 186, 162arrow_forwardThe following refer to the following data set: 69.4 63.3 68.4 56.9 81.4 81.4 40.6 79.8 56 81.4 What is the arithmetic mean of this data set? mean = What is the median of this data set? median = What is the mode of this data set? mode =arrow_forward
arrow_back_ios
arrow_forward_ios
Recommended textbooks for you
- MATLAB: An Introduction with ApplicationsStatisticsISBN:9781119256830Author:Amos GilatPublisher:John Wiley & Sons Inc
 Probability and Statistics for Engineering and th...StatisticsISBN:9781305251809Author:Jay L. DevorePublisher:Cengage Learning
 Statistics for The Behavioral Sciences (MindTap C...StatisticsISBN:9781305504912Author:Frederick J Gravetter, Larry B. WallnauPublisher:Cengage Learning
  Elementary Statistics: Picturing the World (7th E...StatisticsISBN:9780134683416Author:Ron Larson, Betsy FarberPublisher:PEARSON
 The Basic Practice of StatisticsStatisticsISBN:9781319042578Author:David S. Moore, William I. Notz, Michael A. FlignerPublisher:W. H. Freeman
 Introduction to the Practice of StatisticsStatisticsISBN:9781319013387Author:David S. Moore, George P. McCabe, Bruce A. CraigPublisher:W. H. Freeman
MATLAB: An Introduction with Applications
Statistics
ISBN:9781119256830
Author:Amos Gilat
Publisher:John Wiley & Sons Inc
Probability and Statistics for Engineering and th...
Statistics
ISBN:9781305251809
Author:Jay L. Devore
Publisher:Cengage Learning
Statistics for The Behavioral Sciences (MindTap C...
Statistics
ISBN:9781305504912
Author:Frederick J Gravetter, Larry B. Wallnau
Publisher:Cengage Learning
Elementary Statistics: Picturing the World (7th E...
Statistics
ISBN:9780134683416
Author:Ron Larson, Betsy Farber
Publisher:PEARSON
The Basic Practice of Statistics
Statistics
ISBN:9781319042578
Author:David S. Moore, William I. Notz, Michael A. Fligner
Publisher:W. H. Freeman
Introduction to the Practice of Statistics
Statistics
ISBN:9781319013387
Author:David S. Moore, George P. McCabe, Bruce A. Craig
Publisher:W. H. Freeman