Consider the data set in Table 11.3.1, representing the ages (in years) and maintenance costs (in thousands of dollars per year) for five similar printing presses. a. Draw a scatterplot of this data set. What kind of relationship do you see? b. Find the correlation between age and maintenance cost. What do you learn from it? c. Find the least-squares regression equation that predicts maintenance cost from the of the machine. Draw this line on a scatterplot of the data. age d. What would you expect the annual maintenance to be for a press that is seven years old? e. What is a typical size for the prediction errors? f. How much of the variation in maintenance cost can be attributed to the fact that some presses are older than others? g. Does age explain a significant amount of the variation in maintenance cost? How do you know? h. Your conservative associate has suggested that you use $20,000 for planning purposes as the extra annual maintenance cost per additional year of life for each machine. Perform a hypothesis test at the 5% level to see if the extra annual cost is significantly different from your associate's suggestion. TABLE 11.3.11 Age Maintenance Cost 6
Consider the data set in Table 11.3.1, representing the ages (in years) and maintenance costs (in thousands of dollars per year) for five similar printing presses. a. Draw a scatterplot of this data set. What kind of relationship do you see? b. Find the correlation between age and maintenance cost. What do you learn from it? c. Find the least-squares regression equation that predicts maintenance cost from the of the machine. Draw this line on a scatterplot of the data. age d. What would you expect the annual maintenance to be for a press that is seven years old? e. What is a typical size for the prediction errors? f. How much of the variation in maintenance cost can be attributed to the fact that some presses are older than others? g. Does age explain a significant amount of the variation in maintenance cost? How do you know? h. Your conservative associate has suggested that you use $20,000 for planning purposes as the extra annual maintenance cost per additional year of life for each machine. Perform a hypothesis test at the 5% level to see if the extra annual cost is significantly different from your associate's suggestion. TABLE 11.3.11 Age Maintenance Cost 6

Algebra and Trigonometry (MindTap Course List)
4th Edition
ISBN:9781305071742
Author:James Stewart, Lothar Redlin, Saleem Watson
Publisher:James Stewart, Lothar Redlin, Saleem Watson
Chapter1: Equations And Graphs
Section1.FOM: Focus On Modeling: Fitting Lines To Data
Problem 12P: Demand for Candy Bars In this problem you will determine a linear demand equation that describes the...

Related questions
Question
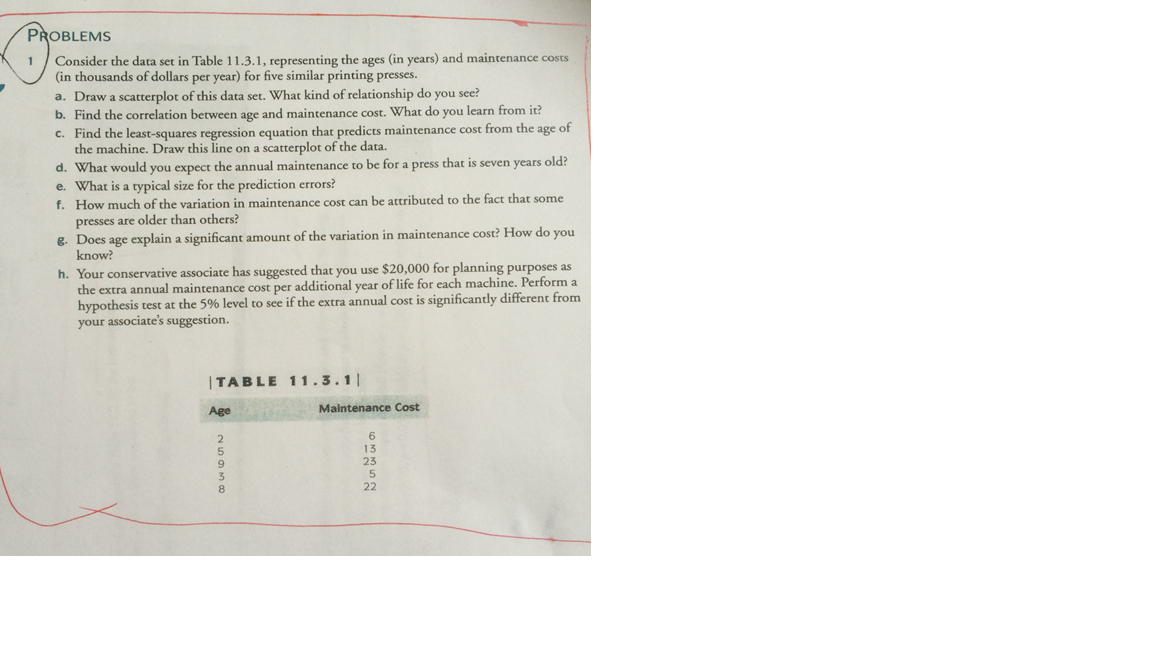
Transcribed Image Text:PROBLEMS
Consider the data set in Table 11.3.1, representing the ages (in years) and maintenance costs
(in thousands of dollars per year) for five similar printing presses.
a. Draw a scatterplot of this data set. What kind of relationship do you see?
b. Find the correlation between age and maintenance cost. What do you learn from it?
c. Find the least-squares regression equation that predicts maintenance cost from the age of
the machine. Draw this line on a scatterplot of the data.
1
d. What would you expect the annual maintenance to be for a press that is seven years old?
e. What is a typical size for the prediction errors?
f. How much of the variation in maintenance cost can be attributed to the fact that some
presses are older than others?
g. Does age explain a significant amount of the variation in maintenance cost? How do you
know?
h. Your conservative associate has suggested that you use $20,000 for planning purposes as
the extra annual maintenance cost per additional year of life for each machine. Perform a
hypothesis test at the 5% level to see if the extra annual cost is significantly different from
your associate's suggestion.
TABLE 11.3.1|
Age
2
5
9
3
8
Maintenance Cost
633526
13
22
Expert Solution
This question has been solved!
Explore an expertly crafted, step-by-step solution for a thorough understanding of key concepts.

This is a popular solution!

Trending now
This is a popular solution!

Step by step
Solved in 3 steps with 13 images

Recommended textbooks for you
Algebra and Trigonometry (MindTap Course List)
Algebra
ISBN:
9781305071742
Author:
James Stewart, Lothar Redlin, Saleem Watson
Publisher:
Cengage Learning

Functions and Change: A Modeling Approach to Coll…
Algebra
ISBN:
9781337111348
Author:
Bruce Crauder, Benny Evans, Alan Noell
Publisher:
Cengage Learning

Algebra and Trigonometry (MindTap Course List)
Algebra
ISBN:
9781305071742
Author:
James Stewart, Lothar Redlin, Saleem Watson
Publisher:
Cengage Learning
Functions and Change: A Modeling Approach to Coll…
Algebra
ISBN:
9781337111348
Author:
Bruce Crauder, Benny Evans, Alan Noell
Publisher:
Cengage Learning

Glencoe Algebra 1, Student Edition, 9780079039897…
Algebra
ISBN:
9780079039897
Author:
Carter
Publisher:
McGraw Hill