MATLAB: An Introduction with Applications
6th Edition
ISBN: 9781119256830
Author: Amos Gilat
Publisher: John Wiley & Sons Inc
expand_more
expand_more
format_list_bulleted
Question

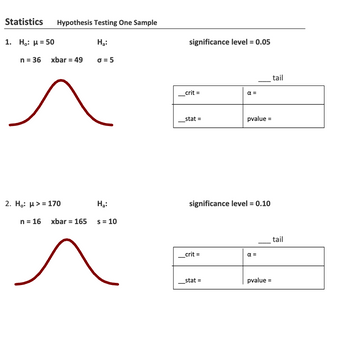
Transcribed Image Text:# Statistics: Hypothesis Testing One Sample
## 1. Hypothesis Test
**Null Hypothesis (H₀):** μ = 50
**Alternative Hypothesis (Hₐ):**
- **Sample size (n):** 36
- **Sample mean (x̄):** 49
- **Population standard deviation (σ):** 5
- **Significance level:** 0.05
### Graph
The graph displays a bell-shaped normal distribution curve.
### Test Details
| | |
|---------------|------|
| **Critical value (__crit):** | |
| **Alpha (α):** | |
| **Test statistic (__stat):** | |
| **P-value:** | |
## 2. Hypothesis Test
**Null Hypothesis (H₀):** μ ≥ 170
**Alternative Hypothesis (Hₐ):**
- **Sample size (n):** 16
- **Sample mean (x̄):** 165
- **Sample standard deviation (s):** 10
- **Significance level:** 0.10
### Graph
The graph displays a bell-shaped normal distribution curve.
### Test Details
| | |
|---------------|------|
| **Critical value (__crit):** | |
| **Alpha (α):** | |
| **Test statistic (__stat):** | |
| **P-value:** | |
Expert Solution
This question has been solved!
Explore an expertly crafted, step-by-step solution for a thorough understanding of key concepts.
Step by stepSolved in 3 steps with 12 images

Knowledge Booster
Similar questions
- Need help with aarrow_forwardQues = Homework: Ch 8 - Sampling Distributions Critical values of the correlation coefficient ars. Com - X Int. Critical Values for Correlation Coefficient Data table 3 0,997 4 0.950 5 0.878 6 0.811 7 0.754 Year Rate of Return of Company Rate of Return of Company ble. Chod 6 2 2007 0.203 0.402 8 0.707 9 0.666 10 0.632 2008 0.310 0.510 2009 0.267 0.410 11 0.602 12 0.576 13 0.553 14 0.532 15 0.514 16 0.497 2010 0.195 0.426 2011 -0.101 -0.060 2012 - 0.130 -0.151 2013 -0.234 -0.357 2014 0.264 0.328 17 0.482 18 0.468 19 0.456 20 0.444 21 0.433 2015 0.090 0.207 2016 0.030 -0.014 2017 0.128 0.113 2018 - 0.035 0.027 22 0.423 23 0.413 24 0.404 25 0.396 Print Done 26 0.388 27 0.381 Tne correlauon coeicient is- (Round to three decimal places as needed.) Print Donearrow_forward59arrow_forward
- on 5 of 21 The heights of women aged 20-29 in the United States are approximately Normal with mean 64.1 inches and standard deviation 3.7 inches. Men the same age have mean height 69.4 inches, with standard deviation 3.1 inches. Cheryl D. Fryar et al., "Anthropometric reference data for children and adults: United States, 2011-2014," Vital and Health Statistics, Series 3, no. 39 (August 2016), at www.cdc.gov/nchs. This report provides the means of various anthropometric measurements. Standard deviations were computed from the sample size and reported standard errors of the mean. Instructions on measuring upper arm length are in the National Health and Nutrition Examination Survey: Anthropometry Procedures Manual, January 2007. Side-by-Side O Macmillan Learning What is the z-score for a woman 5.5 feet tall? Give your answer to two decimal places. Z =arrow_forward0.6.3 Question 3 Is the cubic effect significant? How about quadratic and linear effects? Analysis of Variance Table Response: EX Df Sum Sq Mean Sq F value Pr(>F) MET 1 332 332 0.1246 0.7257742 I(MET^2) 1 37504 37504 14.0572 0.0005141 *** I(MET^3) 1 7245 7245 2.7154 0.1065086 Residuals 44 117390 2668 > anova(quadModel) Analysis of Variance Table Response: EX Df Sum Sq Mean Sq F value Pr(>F) MET 1 332 332 0.120 0.7306134 I(MET^2) 1 37504 37504 13.541 0.0006216 *** Residuals 45 124635 2770 --- Signif. codes: 0 ‘***’ 0.001 ‘**’ 0.01 ‘*’ 0.05 ‘.’ 0.1 ‘ ’ 1arrow_forwardI need help with stats/2023, section 7.2 and 7.3, please help with TI-84 commands A car company says that the mean gas mileage for its luxury sedan is at least 22 miles per gallon (mpg). You believe the claim is incorrect and find that a random sample of 5 cars has a mean gas mileage of 21 mpg and a standard deviation of 5mpg. At α=0.10, test the company's claim. Assume the population is normally distributed. Which sampling distribution should be used and why? A. Use a normal sampling distribution because the population is normal, and σ is known. B. Use a normal sampling distribution because the population is normal, and σ is unknown. C. Use a t-sampling distribution because the population is normal, and σ is unknown. D. Use a t-sampling distribution because n<30. E. Use a t-sampling distribution because the population is normal, and σ is known F. Use a normal sampling distribution because n>30. Write out the appropriate hypotheses…arrow_forward
arrow_back_ios
arrow_forward_ios
Recommended textbooks for you
 MATLAB: An Introduction with ApplicationsStatisticsISBN:9781119256830Author:Amos GilatPublisher:John Wiley & Sons Inc
 Probability and Statistics for Engineering and th...StatisticsISBN:9781305251809Author:Jay L. DevorePublisher:Cengage Learning
 Statistics for The Behavioral Sciences (MindTap C...StatisticsISBN:9781305504912Author:Frederick J Gravetter, Larry B. WallnauPublisher:Cengage Learning
 Elementary Statistics: Picturing the World (7th E...StatisticsISBN:9780134683416Author:Ron Larson, Betsy FarberPublisher:PEARSON
 The Basic Practice of StatisticsStatisticsISBN:9781319042578Author:David S. Moore, William I. Notz, Michael A. FlignerPublisher:W. H. Freeman
 Introduction to the Practice of StatisticsStatisticsISBN:9781319013387Author:David S. Moore, George P. McCabe, Bruce A. CraigPublisher:W. H. Freeman

MATLAB: An Introduction with Applications
Statistics
ISBN:9781119256830
Author:Amos Gilat
Publisher:John Wiley & Sons Inc

Probability and Statistics for Engineering and th...
Statistics
ISBN:9781305251809
Author:Jay L. Devore
Publisher:Cengage Learning

Statistics for The Behavioral Sciences (MindTap C...
Statistics
ISBN:9781305504912
Author:Frederick J Gravetter, Larry B. Wallnau
Publisher:Cengage Learning

Elementary Statistics: Picturing the World (7th E...
Statistics
ISBN:9780134683416
Author:Ron Larson, Betsy Farber
Publisher:PEARSON

The Basic Practice of Statistics
Statistics
ISBN:9781319042578
Author:David S. Moore, William I. Notz, Michael A. Fligner
Publisher:W. H. Freeman

Introduction to the Practice of Statistics
Statistics
ISBN:9781319013387
Author:David S. Moore, George P. McCabe, Bruce A. Craig
Publisher:W. H. Freeman