
A First Course in Probability (10th Edition)
10th Edition
ISBN: 9780134753119
Author: Sheldon Ross
Publisher: PEARSON
expand_more
expand_more
format_list_bulleted
Related questions
Question
thumb_up100%
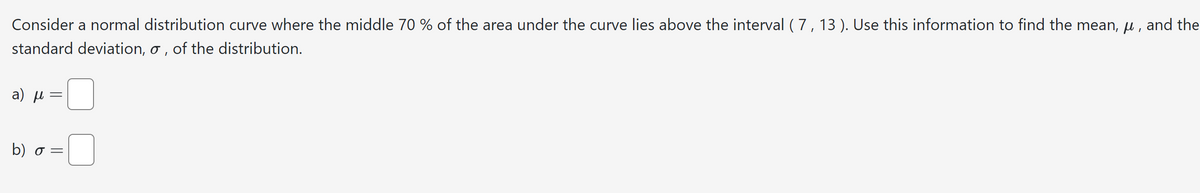

Transcribed Image Text:Consider a normal distribution curve where the middle 70 % of the area under the curve lies above the interval (7, 13). Use this information to find the mean, μ, and the
standard deviation, σ, of the distribution.
a) μ
=
b) σ =
Expert Solution
This question has been solved!
Explore an expertly crafted, step-by-step solution for a thorough understanding of key concepts.

Step by stepSolved in 2 steps

Knowledge Booster

Similar questions
- Sketch a standard normal curve and shade the area that lies to the left of a. -1.15 , b. 0.6 , c. 0 , and d. 4.2 . Then determine the area under the standard normal curve that lies in the area of interest for each part. The area to the left of -1.15 is (Round to four decimal places as needed.) The area to the left of 0.6 is (Round to four decimal places as needed.) The area to the left of 0 is (Round to four decimal places as needed.) The area to the left of 4.2 is (Round to four decimal places as needed.)arrow_forwardA normal distribution has a mean of μ = 50 and a standard deviation of σ =12. Find the proportion of the distribution located in the tail for X = 53.arrow_forwardDiastolic blood pressures are assumed to follow a normal distribution with a mean of 85 and a standard deviation of 12. What proportion of people has diastolic blood pressures less than 80? A)0.661 B)0.338 C)0.50 D)0.75arrow_forward
- Find the area of the shaded region. The graph to the right depicts IQ scores of adults, and those scores are normally distributed with a mean of 100 and a standard deviation of 15. 102 126 A symmetric bell-shaped curve is plotted over a horizontal scale. Two vertical lines run from the scale to the curve at labeled coordinates 102 and 126, which are both to the right of the curve’s center and peak. The area under the curve between the vertical lines is shaded. The area of the shaded region is enter your response here. (Round to four decimal places as needed.)arrow_forwardA normal distribution of scores has a standard deviation of 10 and a mean of 0. Find the z-scores corresponding to each of the following values: a) A score that is 20 points above the mean. b) A score that is 10 points below the mean. c) A score that is 15 points above the mean d) A score that is 30 points below the mean. IQ scores have a mean of 100 and a standard deviation of 16. Albert Einstein reportedly had an IQ of 160. a. Convert Einstein’s IQ score to a z score.arrow_forwardCalculate the coefficient of variation of a distribution with: 2*f = 110 and *² · f = 1235 n = 10, %3D %3D 1.596 75.496 15.2% 25.3%arrow_forward
arrow_back_ios
arrow_forward_ios
Recommended textbooks for you
- A First Course in Probability (10th Edition)ProbabilityISBN:9780134753119Author:Sheldon RossPublisher:PEARSON

A First Course in Probability (10th Edition)
Probability
ISBN:9780134753119
Author:Sheldon Ross
Publisher:PEARSON