
MATLAB: An Introduction with Applications
6th Edition
ISBN: 9781119256830
Author: Amos Gilat
Publisher: John Wiley & Sons Inc
expand_more
expand_more
format_list_bulleted
Related questions
Question

Transcribed Image Text:A
es)
二、2、
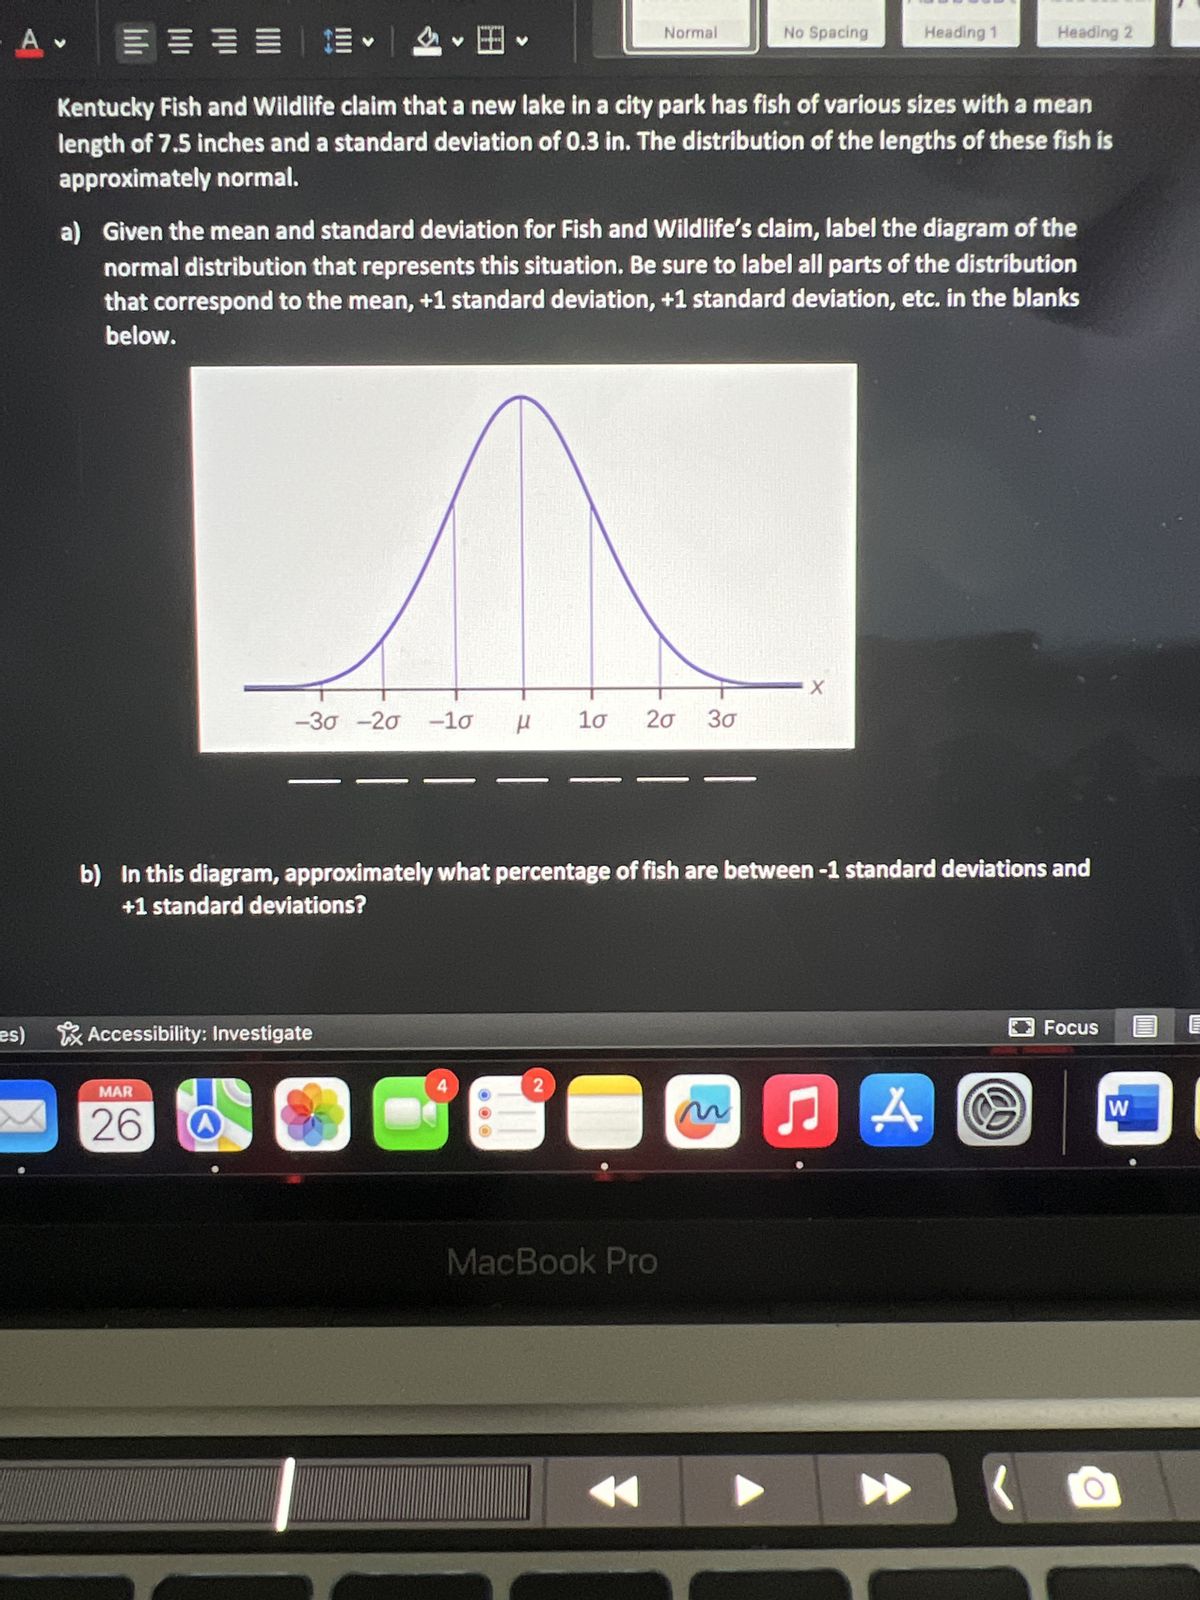
Kentucky Fish and Wildlife claim that a new lake in a city park has fish of various sizes with a mean
length of 7.5 inches and a standard deviation of 0.3 in. The distribution of the lengths of these fish is
approximately normal.
V
Accessibility: Investigate
MAR
26
-30 -20 -10 H
a) Given the mean and standard deviation for Fish and Wildlife's claim, label the diagram of the
normal distribution that represents this situation. Be sure to label all parts of the distribution
that correspond to the mean, +1 standard deviation, +1 standard deviation, etc. in the blanks
below.
μ 1σ
4
Normal
2
20 3σ
b) In this diagram, approximately what percentage of fish are between -1 standard deviations and
+1 standard deviations?
MacBook Pro
No Spacing
m
Heading 1
-X
Heading 2
♫ A
Focus
W
Expert Solution
This question has been solved!
Explore an expertly crafted, step-by-step solution for a thorough understanding of key concepts.

Step by stepSolved in 2 steps with 2 images

Knowledge Booster

Similar questions
- The mean score on a driving exam for a group of drivers education students is 72 points with a standard deviation of 6 points. apply Chebyshev theorem to the data using K=2. Interpret the results. Simplify answer.arrow_forwardplease do questions 3 through 8 as its only related to one question!arrow_forwardThe mean score for first exam in your first organic chemistry class (section A) was 60, with a standard deviation of 5. Your score on the exam was 70. A. How many standard deviations above the mean is your score?arrow_forward
- According to data for a population, 3-year-old boys have a mean height of 39 inches and a standard deviation of 2 inches. Assume the distribution is approximately Normal. Find the percentile measure for a height of 41 inches for a 3-year-old boyarrow_forwardSuppose the distribution of heights of a group of 300 children is normal, with a mean of 150 centimeters and a standard deviation of 12 centimeters. About how many of these children are taller than 162 centimeters? childrenarrow_forwardIf the weight of fertilizer in a 40-pound bag is normally distributed with a standard deviation of 0.5 pounds, what is the range of weights of bags of fertilizer within two standard deviations of the mean?arrow_forward
- Willow Road and Arroyo Seco are schools in different states. The heights of students at Willow Road have a population mean of 50.4 inches and a standard deviation of 6 inches. The heights of students at Arroyo Seco have a population mean of 54.3 inches with a standard deviation of 2.3 inches. For each school, the distribution of the heights of students is clearly bell-shaped.Elsa is a student at Willow Road and is 67 inches tall. Jane is a student at Arroyo Seco and is 59 inches tall.arrow_forwardThe mean speed of vehicles along a stretch of highway is 75 miles per hour with a standard deviation of 3.8 miles per hour. Your current speed along this stretch of highway is 62 miles per hour. What is the z-score for your speed?arrow_forwardIf the mean of a set score is 65 and the standard deviation is 15, what is the zscore of a person whose raw score is 50?arrow_forward
arrow_back_ios
arrow_forward_ios
Recommended textbooks for you
- MATLAB: An Introduction with ApplicationsStatisticsISBN:9781119256830Author:Amos GilatPublisher:John Wiley & Sons Inc
 Probability and Statistics for Engineering and th...StatisticsISBN:9781305251809Author:Jay L. DevorePublisher:Cengage Learning
 Statistics for The Behavioral Sciences (MindTap C...StatisticsISBN:9781305504912Author:Frederick J Gravetter, Larry B. WallnauPublisher:Cengage Learning
  Elementary Statistics: Picturing the World (7th E...StatisticsISBN:9780134683416Author:Ron Larson, Betsy FarberPublisher:PEARSON
 The Basic Practice of StatisticsStatisticsISBN:9781319042578Author:David S. Moore, William I. Notz, Michael A. FlignerPublisher:W. H. Freeman
 Introduction to the Practice of StatisticsStatisticsISBN:9781319013387Author:David S. Moore, George P. McCabe, Bruce A. CraigPublisher:W. H. Freeman
MATLAB: An Introduction with Applications
Statistics
ISBN:9781119256830
Author:Amos Gilat
Publisher:John Wiley & Sons Inc
Probability and Statistics for Engineering and th...
Statistics
ISBN:9781305251809
Author:Jay L. Devore
Publisher:Cengage Learning
Statistics for The Behavioral Sciences (MindTap C...
Statistics
ISBN:9781305504912
Author:Frederick J Gravetter, Larry B. Wallnau
Publisher:Cengage Learning
Elementary Statistics: Picturing the World (7th E...
Statistics
ISBN:9780134683416
Author:Ron Larson, Betsy Farber
Publisher:PEARSON
The Basic Practice of Statistics
Statistics
ISBN:9781319042578
Author:David S. Moore, William I. Notz, Michael A. Fligner
Publisher:W. H. Freeman
Introduction to the Practice of Statistics
Statistics
ISBN:9781319013387
Author:David S. Moore, George P. McCabe, Bruce A. Craig
Publisher:W. H. Freeman