FINANCIAL ACCOUNTING
10th Edition
ISBN: 9781259964947
Author: Libby
Publisher: MCG
expand_more
expand_more
format_list_bulleted
Question

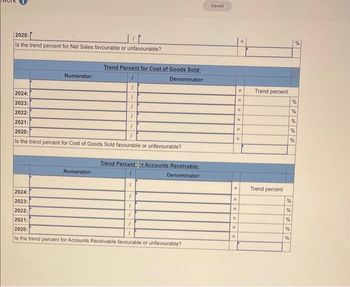
Transcribed Image Text:2020:
Is the trend percent for Net Sales favourable or unfavourable?
Numerator:
Trend Percent for Cost of Goods Sold:
1
Denominator:
1
1
1
1
1
2024:
2023:
2022:
2021:
2020:
Is the trend percent for Cost of Goods Sold favourable or unfavourable?
Numerator:
Trend Percent Accounts Receivable:
Denominator:
2024:
2023:
2022:
2021:
2020:
Is the trend percent for Accounts Receivable favourable or unfavourable?
1
1
Saved
=
11
m
#
H
Trend percent
Trend percent
%
%
%
%
%
%
%
de ge
%
%
%

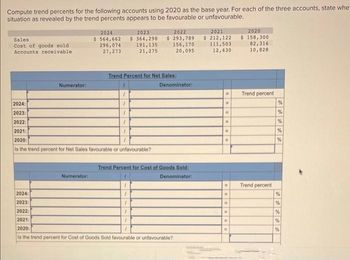
Transcribed Image Text:Compute trend percents for the following accounts using 2020 as the base year. For each of the three accounts, state whe
situation as revealed by the trend percents appears to be favourable or unfavourable.
Sales
Cost of goods sold
Accounts receivable
Numerator:
2024
$ 564,662
296,074
27,273
Numerator:
2024:
2023:
2022:
2021:
2020:
Is the trend percent for Net Sales favourable or unfavourable?
2023
$364,298
191,135
21,275
1
1
1
Trend Percent for Net Sales:
1
$
1
1
2022
293,789
156,170.
20,095
Denominator:
Trend Percent for Cost of Goods Sold:
Denominator:
2024:
2023:
2022:
2021:
2020:
is the trend percent for Cost of Goods Sold favourable or unfavourable?
2021
2020
$ 212,122 $ 158,300
111,503
12,430
=
82,316
10,828
Trend percent
Trend percent
%
de 2
%
***
%
%
%
%
%
%
%
%
Expert Solution
This question has been solved!
Explore an expertly crafted, step-by-step solution for a thorough understanding of key concepts.
This is a popular solution
Trending nowThis is a popular solution!
Step by stepSolved in 2 steps

Knowledge Booster
Learn more about
Need a deep-dive on the concept behind this application? Look no further. Learn more about this topic, accounting and related others by exploring similar questions and additional content below.Similar questions
- Compute trend percents for the following accounts using 2020 as the base year. For each of the three accounts, state whether the situation as revealed by the trend percents appears to be favourable or unfavourable. Sales Cost of goods sold Accounts receivable Numerator: 2024 $ 754,236 372,126 36,731 Numerator: 1 2023 $ 499,494 246,502 29,121 Trend Percent for Net Sales: 1 1 1 1 1 1 2024: 2023: 2022: 2021: 2020: Is the trend percent for Net Sales favourable or unfavourable? 2022 $394,857 196,780 27,127 Prev Denominator: Trend Percent for Cost of Goods Sold: 1 Denominator: 5 of 8 2021 $ 265,005 131,752 15,529 = Next > 2020 $ 196,300 96,187 13,407 Trend percent % % % % %arrow_forward4. A Company has Net Sales of 2,000,000 for 2020, Accounts Recitable for 500,000 in 2020, and Accounts Receivable of 350,000 in 2019. Calculate the Accounts Receivable Turnover Ratio.arrow_forwardSales are $2.45 million in 2020, $2.55 million in 2021, and $2.35 million in 2022.What is the percentage change from 2020 to 2021? What is the percentage change from 2021 to 2022? Be sure to indicate whether the percentage change is an increase or a decrease. (Round your answers to 1 decimal place.)arrow_forward
- please answer within the format by providing formula the detailed workingPlease provide answer in text (Without image)Please provide answer in text (Without image)Please provide answer in text (Without image)arrow_forwardDiscuss on Credit Risk of Nordstrom Time-series analysis Analyze credit risk in the past and current years (You may obtain information about firms’ credit ratings from financial articles as well); trend analysis Cross-sectional analysis - How do you think about current and future firm value? Discuss on Profitability: - Time-series analysis Analyze profitability in the past and current years; Can you find patterns or trends over the three years? Cross-sectional analysisarrow_forwardSuppose the 2022 financial statements of 3M Company report net sales of $23.1 billion. Accounts receivable (net) are $3.2 billion at the beginning of the year and $3.25 billion at the end of the year. Compute 3M’s accounts receivable turnover. - Accounts Recievable turnover ratio=? (times) Compute 3M’s average collection period for accounts receivable in days - Average collection period =? (days)arrow_forward
- Winterwear Clothiers reported the following selected items at April 30, 2025 (last year's-2024-amounts also given as needed): View the financial data. Compute Winterwear Clothiers' (a) acid-test ratio, (b) accounts receivable turnover ratio, and (c) days' sales in receivables for the year ending April 30, 2025. Evaluate each ratio value as strong or weak. Winterwear Clothiers sells on terms of net 30. (Round days' sales in receivables to a whole number.) (Ignore leap-years, using a 365-day where needed.) (a) Compute Winterwear Clothiers' acid-test ratio. (Round your final answer to two decimal places. Abbreviation used: Avg. = Average; Invest. = Investment; Liab. = Liabilities; Merch. = Merchandise; Receiv. = Receivable; Rev. = Revenue.) + + + + Financial Data = Acid-test ratio = Accounts Payable 320,000 Accounts Receivable, net: Cash 260,000 April 30, 2025 $ 270,000 Merchandise Inventory: April 30, 2024 170,000 April 30, 2025 290,000 Cost of Goods Sold 1,150,000 April 30, 2024 200,000…arrow_forwardWhat is the overall assement of the company's credit risk (explain)? Is there any difference between the two years?arrow_forwardCalculate the projected price/earnings ratio and market/book ratio. Explain whether these ratios indicate that investors will be expected to have a high or low opinion of the company. Computron's Balance Sheets (Millions of Dollars) 2019 2020 Assets Cash and equivalents $ 60 $ 50 Short-term investments 100 10 Accounts receivable 400 520 Inventories 620 820 Total current assets $ 1,180 $ 1,400 Gross fixed assets $ 3,900 $ 4,820 Less: Accumulated depreciation 1,000 1,320 Net fixed assets $ 2,900 $ 3,500 Total assets $ 4,080 $ 4,900 Liabilities and equity Accounts payable $ 300 $ 400 Notes payable 50 250 Accruals 200 240 Total current liabilities $ 550 $ 890 Long-term bonds 800 1,100 Total liabilities $ 1,350 $ 1,990 Common stock 1,000 1,000 Retained earnings 1,730 1,910 Total equity $ 2,730 $ 2,910 Total liabilities and equity $ 4,080 $ 4,900…arrow_forward
- Sales Cost of goods sold Accounts receivable Numerator: 2021 $ 446,762 225,881 21,623 Numerator: Compute trend percents for the above accounts, using 2017 as the base year. For each of the three accounts, state whether the situation as revealed by the trend percents appears to be favorable or unfavorable. Numerator: 1 1 1 1 1 1 1 2021: 2020: 2019: 2018: 2017: Is the trend percent for Net Sales favorable or unfavorable? 2020 $ 290,105 146,803 16,913 Trend Percent for Net Sales: 2019 $ 232,084 119,092 15,828 2021: 2020: 2019: 2018: 2017: Is the trend percent for Cost of Goods Sold favorable or unfavorable? Trend Percent for Cost of Goods Sold: 1 Denominator: 7 1 1 1 1 1 I 1 Denominator: Trend Percent for Accounts Receivable: Denominator: 1 1 1 1 2021: 2020: 2019: 2018: 2017: Is the trend percent for Accounts Receivable favorable or unfavorable? 2018 $ 167,570 84,885 9,820 = = = = = = = = = = 2017 $ 128,900 64,450 8,804 = Trend percent Trend percent Trend percent % % % % % % % % % % % % %…arrow_forwardCalculate the 2020 current ratio using the following information: Balance Sheet Cash and Cash Equivalents Marketable Securities Accounts Receivable Total Current Assets Total Assets Current Liabilities Long Term Debt Shareholders Equity Income Statement Interest Expense Net Income Before Income Taxes 1.17 0.60 1.40 0.80 2020 5,000 15,000 10,000 40,000 70,000 50,000 10,000 10,000 7,500 45,000arrow_forwardBased on the following quotes 1/1/20 CAD/USD = 1.85 1/1/21 CAD/USD = 2.25 During 2020, the CAD (against the USD). O appreciated by 21.62% O depreciated by 21.62% appreciated by 17.78% O depreciated by 17.78%arrow_forward
arrow_back_ios
SEE MORE QUESTIONS
arrow_forward_ios
Recommended textbooks for you

 AccountingAccountingISBN:9781337272094Author:WARREN, Carl S., Reeve, James M., Duchac, Jonathan E.Publisher:Cengage Learning,
 Accounting Information SystemsAccountingISBN:9781337619202Author:Hall, James A.Publisher:Cengage Learning,
 Horngren's Cost Accounting: A Managerial Emphasis...AccountingISBN:9780134475585Author:Srikant M. Datar, Madhav V. RajanPublisher:PEARSON
 Intermediate AccountingAccountingISBN:9781259722660Author:J. David Spiceland, Mark W. Nelson, Wayne M ThomasPublisher:McGraw-Hill Education
 Financial and Managerial AccountingAccountingISBN:9781259726705Author:John J Wild, Ken W. Shaw, Barbara Chiappetta Fundamental Accounting PrinciplesPublisher:McGraw-Hill Education


Accounting
Accounting
ISBN:9781337272094
Author:WARREN, Carl S., Reeve, James M., Duchac, Jonathan E.
Publisher:Cengage Learning,

Accounting Information Systems
Accounting
ISBN:9781337619202
Author:Hall, James A.
Publisher:Cengage Learning,

Horngren's Cost Accounting: A Managerial Emphasis...
Accounting
ISBN:9780134475585
Author:Srikant M. Datar, Madhav V. Rajan
Publisher:PEARSON

Intermediate Accounting
Accounting
ISBN:9781259722660
Author:J. David Spiceland, Mark W. Nelson, Wayne M Thomas
Publisher:McGraw-Hill Education

Financial and Managerial Accounting
Accounting
ISBN:9781259726705
Author:John J Wild, Ken W. Shaw, Barbara Chiappetta Fundamental Accounting Principles
Publisher:McGraw-Hill Education