
FINANCIAL ACCOUNTING
10th Edition
ISBN: 9781259964947
Author: Libby
Publisher: MCG
expand_more
expand_more
format_list_bulleted
Related questions
Question
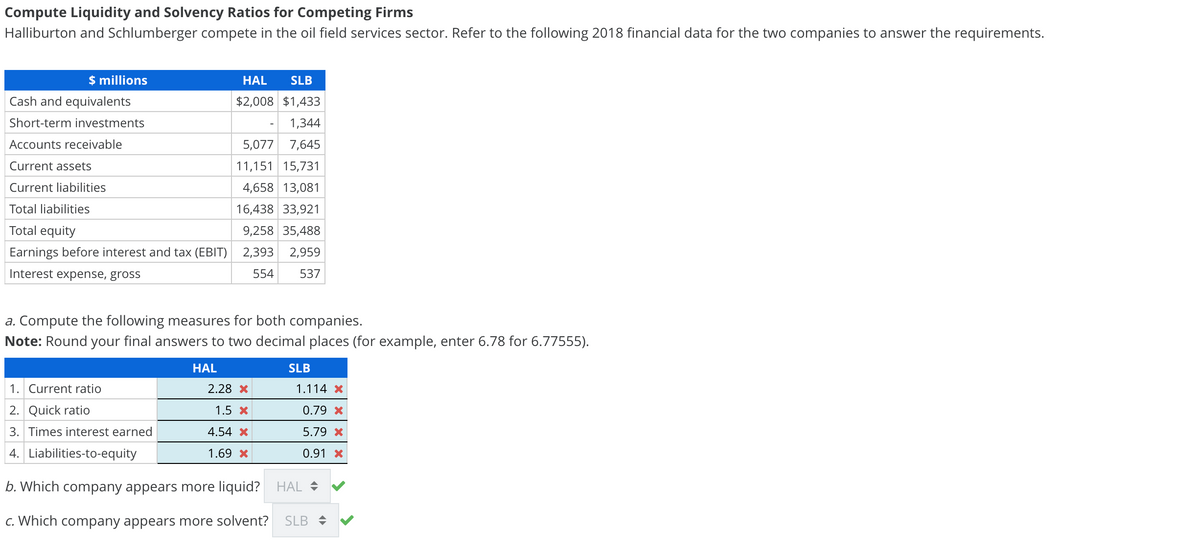

Transcribed Image Text:Compute Liquidity and Solvency Ratios for Competing Firms
Halliburton and Schlumberger compete in the oil field services sector. Refer to the following 2018 financial data for the two companies to answer the requirements.
$ millions
Cash and equivalents
Short-term investments
Accounts receivable
Current assets
Current liabilities
Total liabilities
Total equity
Earnings before interest and tax (EBIT)
Interest expense, gross
a. Compute the following measures for both companies.
Note: Round your final answers to two decimal places (for example, enter 6.78 for 6.77555).
1. Current ratio
2. Quick ratio
3. Times interest earned
4. Liabilities-to-equity
HAL SLB
$2,008 $1,433
1,344
5,077 7,645
11,151 15,731
4,658 13,081
16,438 33,921
9,258 35,488
2,393 2,959
554
537
HAL
2.28 x
1.5 x
4.54 x
1.69 *
SLB
1.114 x
0.79 x
5.79 *
0.91 x
b. Which company appears more liquid? HAL
c. Which company appears more solvent? SLB =
Expert Solution
This question has been solved!
Explore an expertly crafted, step-by-step solution for a thorough understanding of key concepts.

This is a popular solution

Trending nowThis is a popular solution!

Step by stepSolved in 3 steps with 2 images

Knowledge Booster


Learn more about
Need a deep-dive on the concept behind this application? Look no further. Learn more about this topic, accounting and related others by exploring similar questions and additional content below.Similar questions
- Long-Term Solvency Analysis The following information was taken from Station Company's balance sheet: Fixed assets (net) $764,400Long-term liabilities 364,000Total liabilities 1,656,200Total stockholders' equity 1,274,000Determine the company's (a) ratio of fixed assets to long-term liabilities and (b) ratio of liabilities to stockholders' equity. If required, round your answers to one decimal place. a. Ratio of fixed assets to long-term liabilities fill in the blank 1b. Ratio of liabilities to stockholders' equity fill in the blank 2arrow_forwardThe _________ is the internal rate of return a firm must earn on its investment in order to maintain the market value of its stock. a. gross profit margin b. IRR c. Cost of Capital d. net profit margin A snapshot from Violet Flowers Ltd.'s financial information reveals the following for years 2018 and 2019: Item 2018 2019 Long Term Debt $4,600,000 $4,900,000 Interest expense $600,500 $870,000 Dividends $400,000 $590,000 Common Stock $1,740,000 $1,815,000 Additional paid-in surplus $4,200,000 $4,500,000 Violet Flowers' FCF for 2019 was: a. $300,000 b. $515,000 c. $785,000 d. $270,000arrow_forwardCalculate the ratios of Woolworths Group (Australian retail company) for the year 2021: Ratios to calculate: Profitability (ROSF, ROCE, Gross margin, Operating profit margin, Cash flow to Sales*) Efficiency (Inventory turnover period, Average settlement period, Sales revenue to capital employed) Liquidity (Current ratio, Acid test (quick) ratio, Cash flow ratio*). Stability/Capital Structure (Gearing ratio, Interest cover ratio, Debt coverage ratio*) Investment/Market Performance (Earnings per share, Price earnings ratio, Operating cash flow per share*)arrow_forward
- If given the opportunity, in which of the firms would you invest based on the result of your analysis of both companies and the comparison with the industry? If you would not invest, explain your reasons according to the results obtained. Company Name: Year 2018 Chemicals and Allied Products Industry Ratios ………….. Solvency or Debt Ratios Merck J&J 2018 Debt ratio 0.67 0.61 0.47 Debt-to-equity ratio 0.93 0.51 0.38 Interest coverage ratio 12.27 18.91 -9.43 Liquidity Ratios Current ratio 1.17 1.47 3.47 Quick ratio 0.92 1.16 2.12 Cash ratio 0.40 0.63 2.24 Profitability Ratios Profit margin 14.64% 18.75% -93.4% ROE (Return on equity), after tax 23.03% 25.60% -248.5 ROA (Return on assets) 7.49% 10.00% -146.5 Gross margin 68.06% 66.79% 55.3% Operating margin (Return on sales) 19.62% 24.27%…arrow_forward1. Calculate the cash operating cycle of Stone Limited for the year ended 30 April, 2018 and 2019.2. Calculate the comparative ratios for Stone limited for the year ended 30 April 2019. (to two decimal places where appropriate).3. Based on the result of the previous year end and the industry average. Draft a report addressed to the Board of Directors of Stone Limited analysing the performance of the company for the year 2019arrow_forwardYou are an investment analyst at FI Investments tasked to value FBC firm a Southern Agricultural Conglomerate. The following financial information was recently released for FBC. The company’s 2018 and 2017 annual financial reports are contained in tables 1 and 2 below, along with important additional information: Table 1: FBC statement of financial position (R millions) 2018 2017 Cash and equivalents R149 R83 Accounts receivable 295 265 Inventory 275 285 Total current assets R719 R633 Total fixed assets 3 909 3 856 Accounts payable 228 220 Notes payable 0 0 Total current liabilities 228 220 Long term debt 1 800 1 650 Total liabilities and shareholders equity 3 909 3 856 Number of shares outstanding (millions) 100 100 Additional information: Depreciation (2018): R483. The firm spent R250m in profitable projects during the…arrow_forward
- Long-Term Solvency Analysis The following information was taken from Station Company's balance sheet: Fixed assets (net) $1,881,600 Long-term liabilities 448,000 Total liabilities 2,038,400 Total stockholders' equity 1,568,000 Determine the company's (a) ratio of fixed assets to long-term liabilities and (b) ratio of liabilities to stockholders' equity. If required, round your answers to one decimal place. a. Ratio of fixed assets to long-term liabilities fill in the blank b. Ratio of liabilities to stockholders' equity fill in the blankarrow_forwardCompute Liquidity and Solvency Ratios for Competing Firms Halliburton and Schlumberger compete in the oil field services sector. Refer to the following 2018 financial data for the two companies to answer the requirements. $ millions Cash and equivalents Short-term investments Accounts receivable HAL SLB $2,008 $1,433 1,344 5,182 7,802 Current assets Current liabilities Total liabilities Total equity 11,151 15,731 4,754 13,351 16,438 33,921 9,449 36,220 Earnings before interest and tax (EBIT) 2,442 3,020 Interest expense, gross 554 537 a. Compute the following measures for both companies. Note: Round your final answers to two decimal places (for example, enter 6.78 for 6.77555). HAL SLB 1. Current ratio 2.32 X 1.17 x 2. Quick ratio 1.5 x 0.68 * 3. Times interest earned 4.45 x 5.67 x 4. Liabilities-to-equity 1.7 x 0.92 x b. Which company appears more liquid? HAL c. Which company appears more solvent? SLB =>arrow_forwardCompute Liquidity and Solvency Ratios for Competing Firms Halliburton and Schlumberger compete in the oil field services sector. Refer to the following 2018 financial data for the two companies to answer the requirements. $ millions Cash and equivalents Short-term investments Accounts receivable Current assets Current liabilities Total liabilities Total equity Earnings before interest and tax (EBIT) Interest expense, gross HAL SLB $2,008 $1,433 1,344 5,391 8,117 11,151 15,731 4,946 13.891 16,438 33,921 1. Current ratio 2. Quick ratio 3. Times interest earned 4. Liabilities-to-equity 9,830 37,684 2,541 3,142 554 537 a. Compute the following measures for both companies. Note: Round your final answers to two decimal places (for example, enter 6.78 for 6.77555). HAL SLB b. Which company appears more liquid? c. Which company appears more solvent? ◆arrow_forward
- Calculate the Rate of Return on Assets (ROA) for 2011. Disaggregate ROA into the profit margin for ROA and total assets turnover components. Calculate the Rate of Return on Common Stockholders’ Equity (ROCE) for 2011. Disaggregate ROCE into the profit margin for ROCE, total assets turnover and capital structure leverage components.arrow_forwarda) Consider the financial ratios of ABK Bank and the average ratios of peer banks based on 2015 year-end data shown in the table below: Ratios ABK Bank Peer Banks Return on equity (ROE) 14.50% 7.40% Return on assets (ROA) Asset utilisation (AU) Expense ratio (ER) 1.68% 0.85% 6.65% 5.50% 4.95% 4.62% TAX 0.02% 0.03% Note that TAX = applicable income tax/total assets Compare and critically discuss the performance of ABK Bank and that of its peer banks. Conduct a return on equity decomposition analysis for ABK bank and the peer banks as part of your discussion. What are the possible limitations in your analysis?arrow_forwardPERFORM A LIQUIDITY AND PROFITABILITY ANALYSIS ON THE FOLLOWING COMPANY UTILIZING THE FOLLOWING RATIOS: ASSET TURNOVER RETURN ON ASSESTS RETURN ON EQUITY statement of operations 12 Months Ended Jul. 31, 2020 Jul. 31, 2019 Revenues: Revenues $ 1,497,826,000 $ 1,684,392,000 Costs and expenses: Operating expense - personnel, vehicle, plant and other 493,055,000 468,868,000 Operating expense - equipment lease expense 33,017,000 Equipment lease expense, preadoption 33,073,000 Depreciation and amortization expense 80,481,000 78,846,000 General and administrative expense 45,752,000 59,994,000 Non-cash employee stock ownership plan compensation charge 2,871,000 5,693,000 Asset impairments 0 0 Loss on asset sales and disposals 7,924,000 10,968,000 Operating income 148,670,000 113,028,000 Interest expense (192,962,000) (177,619,000) Loss on extinguishment of debt (37,399,000) Other income (expense), net (460,000) 369,000 Loss before income…arrow_forward
arrow_back_ios
SEE MORE QUESTIONS
arrow_forward_ios
Recommended textbooks for you
 AccountingAccountingISBN:9781337272094Author:WARREN, Carl S., Reeve, James M., Duchac, Jonathan E.Publisher:Cengage Learning,
 Accounting Information SystemsAccountingISBN:9781337619202Author:Hall, James A.Publisher:Cengage Learning,
 Horngren's Cost Accounting: A Managerial Emphasis...AccountingISBN:9780134475585Author:Srikant M. Datar, Madhav V. RajanPublisher:PEARSON
 Intermediate AccountingAccountingISBN:9781259722660Author:J. David Spiceland, Mark W. Nelson, Wayne M ThomasPublisher:McGraw-Hill Education
 Financial and Managerial AccountingAccountingISBN:9781259726705Author:John J Wild, Ken W. Shaw, Barbara Chiappetta Fundamental Accounting PrinciplesPublisher:McGraw-Hill Education
Accounting
Accounting
ISBN:9781337272094
Author:WARREN, Carl S., Reeve, James M., Duchac, Jonathan E.
Publisher:Cengage Learning,
Accounting Information Systems
Accounting
ISBN:9781337619202
Author:Hall, James A.
Publisher:Cengage Learning,
Horngren's Cost Accounting: A Managerial Emphasis...
Accounting
ISBN:9780134475585
Author:Srikant M. Datar, Madhav V. Rajan
Publisher:PEARSON
Intermediate Accounting
Accounting
ISBN:9781259722660
Author:J. David Spiceland, Mark W. Nelson, Wayne M Thomas
Publisher:McGraw-Hill Education
Financial and Managerial Accounting
Accounting
ISBN:9781259726705
Author:John J Wild, Ken W. Shaw, Barbara Chiappetta Fundamental Accounting Principles
Publisher:McGraw-Hill Education