
MATLAB: An Introduction with Applications
6th Edition
ISBN: 9781119256830
Author: Amos Gilat
Publisher: John Wiley & Sons Inc
expand_more
expand_more
format_list_bulleted
Related questions
Question
thumb_up100%
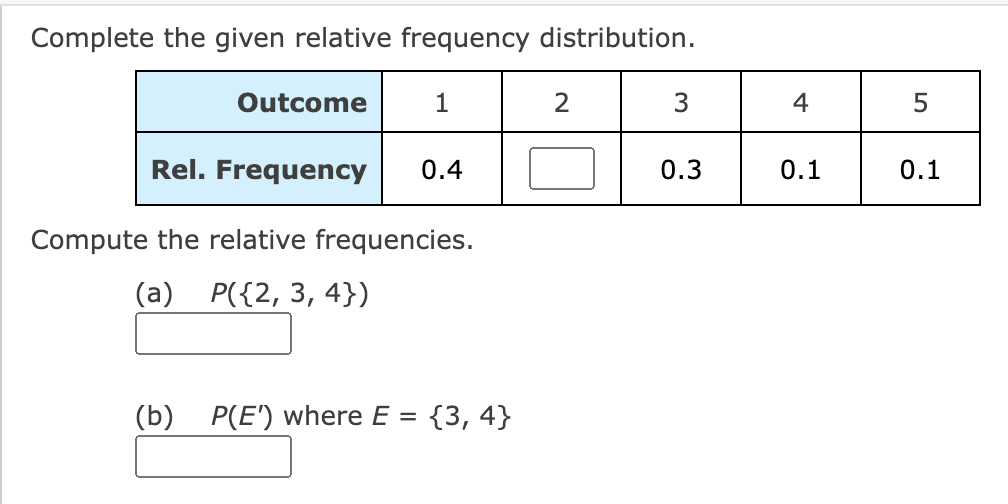

Transcribed Image Text:Complete the given relative frequency distribution.
Outcome
(b)
1
Rel. Frequency
Compute the relative frequencies.
(a) P({2, 3, 4})
0.4
P(E') where E = {3,4}
2
3
0.3
4
0.1
5
0.1
Expert Solution
This question has been solved!
Explore an expertly crafted, step-by-step solution for a thorough understanding of key concepts.

Step by stepSolved in 2 steps with 2 images

Knowledge Booster

Similar questions
- #23). Need help solving problem.arrow_forwardll T-Mobile LTE 11:30 PM 85% Done 3 of 10 RXM M FOU Oe FI O as O TO F O F GGa an a sludert.desmos.com/activitybuilder/student/G07od3afe7ce2849451468b54soreenldx-3 E Apos a CnCcurs Cener. a CnCcursa Clara Destiny she.. O Emeloyment Conte Login Sersion Eepiration. Update : b Seling AsscER E Synin P view Portrait Prce. view Portait Preo. 6 N.rsng Tradlion. = Unit 4, Lesson Destiry Ofrenbu 8: Not Always Ideal 3 of 15 Next > What is Reasonable? What is the probability that you will flip heads when flipping a coin? Estimate the number of heads you will get when you flp a coin 20 times. Share with Class Share with Class %23 2 3 4 7 9 delete Q R T. Y U tab A F G H. J K. aps lock return X C B N M control option command command option !!arrow_forwardLet T represent the lifetime in years of a part which follows a Weibull distribution with shape 2 and scale 5. (a) What is E(T )? Make sure to simplify the gamma function in terms of pi.(b) What is V(T )? Make sure to simplify the gamma function in terms of pi.arrow_forward
- х1 x2 x3 13.92 3.5 94 13.85 2.12 98 13.59 2.2 48 13.32 3.09 90 14.89 4.31 110 12.9 3.21 104 14.2 3.34 114 13.78 3.01 87 13.38 2.49 102 14.38 2.69 105 14.35 2.26 101 14.78 3.34 60 13.95 2.3 144 14.34 2.95 73 14.64 2.93 89 13.92 2.96 124 13.23 3.42 107 14.58 3.14 87 13.42 3.15 85 13.51 3.86 146 14.15 3.15 163 13.9 3.08 165 12.34 2.09 143 14.22 2.68 58 13.39 2.1 73 14.22 1.89 115 13.44 2.03 89 13.4 2.19 101arrow_forwardOver doses from opioids have captured the national spotlight. Rightly so they kill nearly 30,000 Americas a year and cause more than 1 million hospitalizations. However, the misuse of over-the-counter pain medications (e.g. Tylenol, Advil, Aleve) can cause stomach bleeding, ulcers, liver disease and, in some cases, death. Approximately 80% of Americans use these medications to relieve headaches, backaches, sore muscles, and reduce fever but they are unaware of the dangers if the drugs are not used correctly. A random sample (n=101) of adults were given a questionnaire to ask the question "How often do you use pain medication in one day?". Using the output, histogram, box- whisker plot, and the QQ Plot attached - check the assumption of normality for this data. PainNormalityInformationoutputhistbox 210317.pdf The assumption of normality was checked by comparing the and the median. This suggests that the distribution is slightly The + The is between the acceptable range of -3 and +3.…arrow_forwardsub questions 1,2 and 3 pleasearrow_forward
- 1. Let X be an RV with PDF a. Find the mean of X. b. Find the variance of X. f(x) = {¹ -=| - |x| for x < 1 otherwisearrow_forward*2. Let log Y the median of Y). ~ N (u, o2). Find the distribution of Y and show that P(Y < eH) = 0.5 (i.e., el isarrow_forwardSend data to Excel Observed frequency fo Expected frequency ƒE 2 (fo-fe) ƒE Winter Spring Summer 35 1 ☐ 23 37.50 5.607 44 37.50 Fall 48 П 1.127 1 Total 150 Xarrow_forward
- 3. 1 + x Check whether the following function is a valid pdf? If it is valid, obtain its CDF. If not valid, would scaling by a constant make it valid? If so, make it valid. Obtain its CDF? What is its mean? Variance? ƒ = —exp(-√x)U(x)arrow_forwardCh. 6.1 CI What sample size is needed to give the desired margin of error in estimating a population proportion with the indicated level of confidence? (16) A margin of error within +/- 1% with 99% confidence. (18) A margin of error within +/- 2% with 95% confidence. An initial small sample has p-hat=0.78arrow_forwardHelp 1. Is there a significant difference between Group X and Group Y? How do you know?arrow_forward
arrow_back_ios
arrow_forward_ios
Recommended textbooks for you
- MATLAB: An Introduction with ApplicationsStatisticsISBN:9781119256830Author:Amos GilatPublisher:John Wiley & Sons Inc
 Probability and Statistics for Engineering and th...StatisticsISBN:9781305251809Author:Jay L. DevorePublisher:Cengage Learning
 Statistics for The Behavioral Sciences (MindTap C...StatisticsISBN:9781305504912Author:Frederick J Gravetter, Larry B. WallnauPublisher:Cengage Learning
  Elementary Statistics: Picturing the World (7th E...StatisticsISBN:9780134683416Author:Ron Larson, Betsy FarberPublisher:PEARSON
 The Basic Practice of StatisticsStatisticsISBN:9781319042578Author:David S. Moore, William I. Notz, Michael A. FlignerPublisher:W. H. Freeman
 Introduction to the Practice of StatisticsStatisticsISBN:9781319013387Author:David S. Moore, George P. McCabe, Bruce A. CraigPublisher:W. H. Freeman
MATLAB: An Introduction with Applications
Statistics
ISBN:9781119256830
Author:Amos Gilat
Publisher:John Wiley & Sons Inc
Probability and Statistics for Engineering and th...
Statistics
ISBN:9781305251809
Author:Jay L. Devore
Publisher:Cengage Learning
Statistics for The Behavioral Sciences (MindTap C...
Statistics
ISBN:9781305504912
Author:Frederick J Gravetter, Larry B. Wallnau
Publisher:Cengage Learning
Elementary Statistics: Picturing the World (7th E...
Statistics
ISBN:9780134683416
Author:Ron Larson, Betsy Farber
Publisher:PEARSON
The Basic Practice of Statistics
Statistics
ISBN:9781319042578
Author:David S. Moore, William I. Notz, Michael A. Fligner
Publisher:W. H. Freeman
Introduction to the Practice of Statistics
Statistics
ISBN:9781319013387
Author:David S. Moore, George P. McCabe, Bruce A. Craig
Publisher:W. H. Freeman