
MATLAB: An Introduction with Applications
6th Edition
ISBN: 9781119256830
Author: Amos Gilat
Publisher: John Wiley & Sons Inc
expand_more
expand_more
format_list_bulleted
Related questions
Topic Video
Question

Transcribed Image Text:ll T-Mobile LTE
10:58 PM
85%
Done
1 of 3
x MM aM O
o e 3 0 FU O a . 9 E F TI 9 0 E
FJJ
+w w TJ FX G O +
A student.desmos.com/activitybuilder/studenti607e171508264d0ebdre(178tseroenida=4
Upcusa
E Apps OnCeure Cornec..
Clara Destiny she.
3 Emelyment
9 Emcloyment Center + Locin I Sessken Espratinn
b Seling Assdilu.
A Hanin E Vow Pe Prap. Nrra on
Fe Pat
= Unit 4, Lesson 9: Variability in Samples
Desiny Ofoogbi
4 12
Noc >
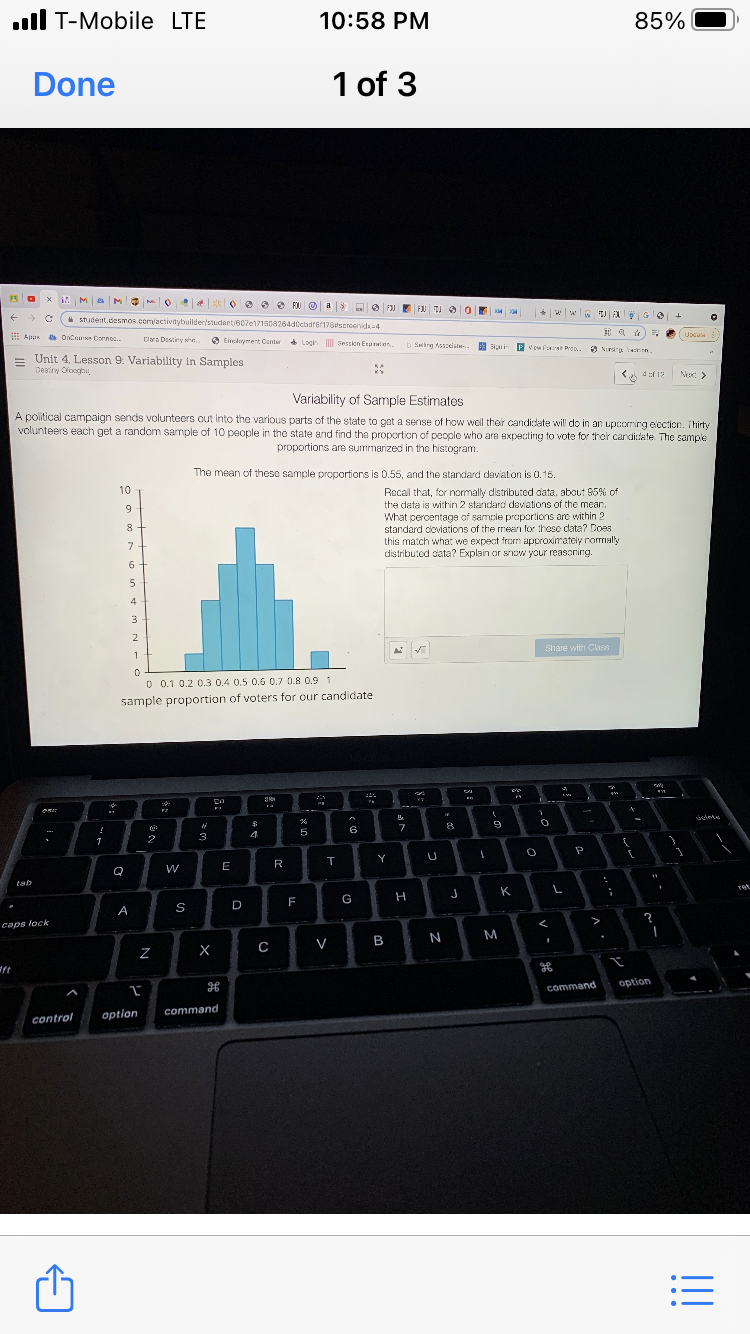
Variability of Sample Estimates
A political campaign sends volunteers out into the various parts of the state to get a sense of how well their candidate will do in an upcoming elcction. Thirty
volunteers each get a random sample of 10 people in tho state and find the proportion of people who are expecting to vote for ther candidate. The sample
proportions are summarized in the histogram.
The mean of these sample proportions is 0.55, and the standard deviation is 0.15.
10
Recal that, for normally distributed data, about 95% of
the data is within 2 standard deviations of the mean.
9
What peroentage of sample praportions are within 2
standard doviations of the rmean for these data? Does
this match what we expect from approximately norrally
distributed data? Explain or snow your reasoning.
7+
4
2
Share with Clasa
1
O 0.1 0.2 0.3 0.4 0.5 0.6 0.7 0.8 0.9 1
sample proportion of voters for our candidate
7
9
6
2
3
4
P
Y
W
E
R
Q
tab
K
F
G
A
S
D
caps lock
V
B
ift
option
command
command
control
option
!!
Expert Solution
This question has been solved!
Explore an expertly crafted, step-by-step solution for a thorough understanding of key concepts.

Step by stepSolved in 2 steps with 2 images

Knowledge Booster


Learn more about
Need a deep-dive on the concept behind this application? Look no further. Learn more about this topic, statistics and related others by exploring similar questions and additional content below.Similar questions
- This research was conducted with Korean adolescents in the Los Angeles area. Would you be willing to generalize the results of this study to Korean adolescents who live in other regions of the country? Why or why not.arrow_forwardGive one method to increase statistical power and Which test statistic should you use if you are comparing two variances?arrow_forwardA small hospital wants to create a more welcoming environment for patients with mental illnesses--starting with employee training. As part of a pre-training assessment, employees complete a 10-point Attitudes Toward Mental Illness scale (higher = more positive attitudes). The pre-training data are: 4, 10, 2, 7, 7, 6, 6 Make a Frequency Table 1 Make a Frequency Histogram 2 Find the mean, median & mode 3 Calculate the SD What are the (pre-training) employee attitudes toward mental illness like?arrow_forward
- Please help thank youarrow_forwardA survey was conducted to measure the height of Canadian men. In the survey, respondents were grouped by age. In the 20-29 age group, the height was normally distributed, with a mean of 69.2 inches and a standard deviation of 2.9 inches. A study participant is randomly selected. Find P80, the 80th percentile Find P50, the 50th percentile Find the height that corresponds to the first quartile please show all steps using excel formulasarrow_forwardThe average number of cavities that thirty-year-old Americans have had in their lifetimes is 5. Do twenty year-olds have fewer cavities? The data show the results of a survey of 15 twenty-year-olds who were asked how many cavities they have had. Assume that the distribution of the population is normal. 3, 4, 4, 4, 5, 5, 6, 4, 5, 4, 3, 5, 6, 5, 3 What can be concluded at the a = 0.05 level of significance? a. For this study, we should use Select an answer b. The null and alternative hypotheses would be: Ho: ? v|| Select an answer H: ?v Select an answer v c. The test statistic ? (please show your answer to 3 decimal places.) d. The p-value = (Please show your answer to 4 decimal places.) e. The p-value is ? va f. Based on this, we should Select an answer v the null hypothesis. g. Thus, the final conclusion is that ... O The data suggest the populaton mean is significantly less than 5 at o =- 0.05, so there is sufficient evidence to conclude that the population mean number of cavities for…arrow_forward
- The weights of students in a large statistics class vary according to a normal distribution with mean 145 pounds and standard deviation 18 pounds what percent of students weigh less than 100 pounds ?arrow_forwardPlzzz explainarrow_forwardYou are part of a trivia team and have tracked your team's performance since you started playing, so you know that your scores are normally distributed with u = 76 and o = 12. Recently, a new person joined the team, and you think the scores have gotten better. The sample data is n = 12, sample mean = 86 Assuming a one tailed test, What is the test statistic?arrow_forward
- The principal at Riverside High School would like to estimate the mean length of time each day that it takes all the buses to arrive and unload the students. What is the minimum sample size needed if the principal would like to be 90% confident that the sample mean is off by, at most, 2 minutes. Assume that standard deviation is 14 minutes. (Approximate the final answer)arrow_forwardLetter Rarrow_forwardThe number of violent crimes committed in a day possesses a distribution with a mean of 2.1 crimes per day and a standard deviation of 5 crimes per day. A random sample of 100 days was observed, and the mean number of crimes for the sample was calculated. Describe the sampling distribution of the sample mean.arrow_forward
arrow_back_ios
arrow_forward_ios
Recommended textbooks for you
- MATLAB: An Introduction with ApplicationsStatisticsISBN:9781119256830Author:Amos GilatPublisher:John Wiley & Sons Inc
 Probability and Statistics for Engineering and th...StatisticsISBN:9781305251809Author:Jay L. DevorePublisher:Cengage Learning
 Statistics for The Behavioral Sciences (MindTap C...StatisticsISBN:9781305504912Author:Frederick J Gravetter, Larry B. WallnauPublisher:Cengage Learning
  Elementary Statistics: Picturing the World (7th E...StatisticsISBN:9780134683416Author:Ron Larson, Betsy FarberPublisher:PEARSON
 The Basic Practice of StatisticsStatisticsISBN:9781319042578Author:David S. Moore, William I. Notz, Michael A. FlignerPublisher:W. H. Freeman
 Introduction to the Practice of StatisticsStatisticsISBN:9781319013387Author:David S. Moore, George P. McCabe, Bruce A. CraigPublisher:W. H. Freeman
MATLAB: An Introduction with Applications
Statistics
ISBN:9781119256830
Author:Amos Gilat
Publisher:John Wiley & Sons Inc
Probability and Statistics for Engineering and th...
Statistics
ISBN:9781305251809
Author:Jay L. Devore
Publisher:Cengage Learning
Statistics for The Behavioral Sciences (MindTap C...
Statistics
ISBN:9781305504912
Author:Frederick J Gravetter, Larry B. Wallnau
Publisher:Cengage Learning
Elementary Statistics: Picturing the World (7th E...
Statistics
ISBN:9780134683416
Author:Ron Larson, Betsy Farber
Publisher:PEARSON
The Basic Practice of Statistics
Statistics
ISBN:9781319042578
Author:David S. Moore, William I. Notz, Michael A. Fligner
Publisher:W. H. Freeman
Introduction to the Practice of Statistics
Statistics
ISBN:9781319013387
Author:David S. Moore, George P. McCabe, Bruce A. Craig
Publisher:W. H. Freeman