
MATLAB: An Introduction with Applications
6th Edition
ISBN: 9781119256830
Author: Amos Gilat
Publisher: John Wiley & Sons Inc
expand_more
expand_more
format_list_bulleted
Related questions
Question
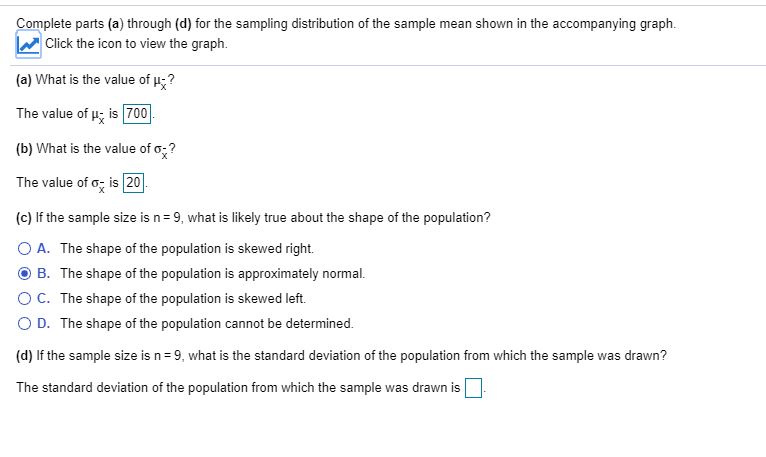

Transcribed Image Text:Complete parts (a) through (d) for the sampling distribution of the sample mean shown in the accompanying graph.
Click the icon to view the graph.
(a) What is the value of u?
The value of u; is 700
(b) What is the value of o;?
The value of o; is 20.
(c) If the sample size is n= 9, what is likely true about the shape of the population?
O A. The shape of the population is skewed right.
B. The shape of the population is approximately normal.
OC. The shape of the population is skewed left.
O D. The shape of the population cannot be determined.
(d) If the sample size is n= 9, what is the standard deviation of the population from which the sample was drawn?
The standard deviation of the population from which the sample was drawn is
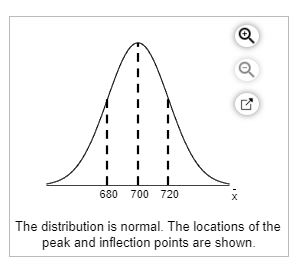
Transcribed Image Text:680 700 720
The distribution is normal. The locations of the
peak and inflection points are shown.
Expert Solution
This question has been solved!
Explore an expertly crafted, step-by-step solution for a thorough understanding of key concepts.

This is a popular solution

Trending nowThis is a popular solution!

Step by stepSolved in 2 steps with 4 images

Knowledge Booster

Similar questions
- The frequency distribution to the right shows the various levels of demand for a particular laptop computer sold by a store during the last 50 business days. Determine the average number of laptops sold per day. Number of Laptops Frquency 0 251 52 63 114 15 2arrow_forwardGiven frequency distribution depicts the scores on a math test. Scores Number of students 60--69 5 70--79 9 80--89 25 90--99 7 Find the class midpoints for class 80--89 Find the class widtharrow_forwardFor the data in the table, find the mean and the median of the monthly high temperatures. Then do the same for the monthly low temperatures. The mean of the high temperatures is ______F (type an integer or a decimal.) Month High low Jan 17 8 Feb 23 13 Mar 30 19 Temperatures are in degrees fahrenheit Apr 41 28 May 54 43arrow_forward
- describe the steps you would take to construct a frequency distributionarrow_forwardIn the frequency distribution below, the first column (class limits) gives the age ranges (in years) of people who participate in a survey. The second column gives the frequency for each age range. a. Determine the class width. If needed, you can use the space below the table. b. Complete the rest of the frequency distribution. For the relative frequency column, round your answers to 2 decimal places. Class Limits Frequency Class Boundaries Class Midpoints Relative Frequency Cumulative Frequency 18-26 16 27-35 24 36-44 38 45-53 34 54-62 26 63-71 12 Total 150arrow_forwardUse the Histogram tool to develop a frequency distribution and histogram for the number of months as a customer of the bank in the data below. Compute the relative and cumulative relative frequencies and use a line chart to construct an ogive. Complete the frequency distribution for the months as a customer, and compute the relative and cumulative relative frequencies. (Type integers or decimals rounded to three decimal places as needed.) Bins Frequency Relative Frequency Cumulative Relative Frequency 10 enter your response here enter your response here enter your response here 20 enter your response here enter your response here enter your response here 30 enter your response here enter your response here enter your response here 40 enter your response here enter your response here enter your response here 50 enter your response here enter your response here enter your…arrow_forward
- is a graph showing the number of observations in each class of a frequency distribution. O a histogram O b. polygon O c. frequency distribution O d. relative frequency distributionarrow_forwardThe gas mileages (in miles per gallon) for 26 cars are shown in the frequency distribution. Approximate the mean of the frequency distribution. The approximate mean of the frequency distribution is (Round to one decimal place as needed.) Gas Mileage (in miles per gallon) 26-29 30-33 34-37 38-41 Frequency 8 10 2 6arrow_forward
arrow_back_ios
arrow_forward_ios
Recommended textbooks for you
- MATLAB: An Introduction with ApplicationsStatisticsISBN:9781119256830Author:Amos GilatPublisher:John Wiley & Sons Inc
 Probability and Statistics for Engineering and th...StatisticsISBN:9781305251809Author:Jay L. DevorePublisher:Cengage Learning
 Statistics for The Behavioral Sciences (MindTap C...StatisticsISBN:9781305504912Author:Frederick J Gravetter, Larry B. WallnauPublisher:Cengage Learning
  Elementary Statistics: Picturing the World (7th E...StatisticsISBN:9780134683416Author:Ron Larson, Betsy FarberPublisher:PEARSON
 The Basic Practice of StatisticsStatisticsISBN:9781319042578Author:David S. Moore, William I. Notz, Michael A. FlignerPublisher:W. H. Freeman
 Introduction to the Practice of StatisticsStatisticsISBN:9781319013387Author:David S. Moore, George P. McCabe, Bruce A. CraigPublisher:W. H. Freeman
MATLAB: An Introduction with Applications
Statistics
ISBN:9781119256830
Author:Amos Gilat
Publisher:John Wiley & Sons Inc
Probability and Statistics for Engineering and th...
Statistics
ISBN:9781305251809
Author:Jay L. Devore
Publisher:Cengage Learning
Statistics for The Behavioral Sciences (MindTap C...
Statistics
ISBN:9781305504912
Author:Frederick J Gravetter, Larry B. Wallnau
Publisher:Cengage Learning
Elementary Statistics: Picturing the World (7th E...
Statistics
ISBN:9780134683416
Author:Ron Larson, Betsy Farber
Publisher:PEARSON
The Basic Practice of Statistics
Statistics
ISBN:9781319042578
Author:David S. Moore, William I. Notz, Michael A. Fligner
Publisher:W. H. Freeman
Introduction to the Practice of Statistics
Statistics
ISBN:9781319013387
Author:David S. Moore, George P. McCabe, Bruce A. Craig
Publisher:W. H. Freeman