FINANCIAL ACCOUNTING
10th Edition
ISBN: 9781259964947
Author: Libby
Publisher: MCG
expand_more
expand_more
format_list_bulleted
Question

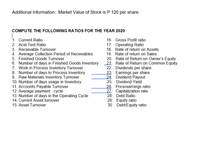
Transcribed Image Text:Additional Information: Market Value of Stock is P 120 per share.
COMPUTE THE FOLLOWING RATIOS FOR THE YEAR 2020
1. Current Ratio
2. Acid Test Ratio
16. Gross Profit ratio
17. Operating Ratio
18. Rate of return on Assets
19. Rate of return on Sales
3. Receivable Turnover
4. Average Collection Period of Receivables
5. Finished Goods Turnover
6. Number of days in Finished Goods Inventory
7. Work in Process Inventory Turnover
8. Number of days to Process Inventory
9. Raw Materials Inventory Turnover
10. Number of days usage in Inventory
11. Accounts Payable Turnover
12. Average payment cycle
13. Number of days in the Operating Cycle
14. Current Asset turnover
20. Rate of Return on Owner's Equity
„21. Rate of Return on Common Equity
22. Dividends per share
23. Earnings per share
24. Dividend Payout
25. Dividend Yield
26. Price/earnings ratio
27. Capitalization rate
28. Debt Ratio
29. Equity ratio
30. Debt/Equity ratio
15. Asset Turnover

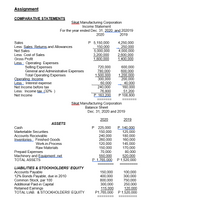
Transcribed Image Text:Assignment
COMPARATIVE STATEMENTS
Sikat Manufacturing Corporation
Income Statement
For the year ended Dec. 31, 2020 and 202019
2020
2019
P 5,150,000
-150,000
5,000,000
3,200,000
1,800,000
Sales
4,250,000
na 250.000
4,000,000
2.600,000
1,400,000
Less: Sales Returns and Allowances
Net Sales
Less: Cost of Sales
Gross Profit
Less: Operating Expenses
Selling Expenses
General and Administrative Expenses
Total Operating Expenses
Operating Income
Less: Interest expense
Net Income before tax
Less: Income tax.(32% )
Net Income
720,000
780,000
1,500,000
300,000
60,000
240,000
76,800
P 163.200
600,000
600,000
1,200,000
200,000
40,000
160,000
51,200
P 108,800
Sikat Manufacturing Corporation
Balance Sheet
Dec. 31, 2020 and 2019
2020
2019
ASSETS
P 225,000
150,000
240,000
260,000
120,000
150,000
70,000
550,000
P1.765.000 P 1,520,000
Cash
P140.000
125,000
180,000
160,000
145,000
170,000
80,000
520,000
Marketable Securities
Accounts Receivable
Inventories: Finished Goods
Work-in-Process
Raw Materials
Prepaid Expenses
Machinery and Equipment.net
TOTAL ASSETS
LIABILITIES & STOCKHOLDERS' EQUITY
Accounts Payable
12% Bonds Payable, due in 2010
Common Stock, par 100
Additional Paid-in Capital
Retained Earnings
TOTAL LIAB. & STOCKHOLDERS' EQUITY
150,000
400,000
800,000
300,000
115,000
P1,765,000 P 1,520,000
100,000
300,000
750,000
250,000
120,000
Expert Solution
This question has been solved!
Explore an expertly crafted, step-by-step solution for a thorough understanding of key concepts.
This is a popular solution
Trending nowThis is a popular solution!
Step by stepSolved in 3 steps

Knowledge Booster
Learn more about
Need a deep-dive on the concept behind this application? Look no further. Learn more about this topic, accounting and related others by exploring similar questions and additional content below.Similar questions
- LOGIC COMPANY Comparative Income Statement For Years Ended December 31, 2019 and 2020 2020 2019 Gross sales $20,600 $16,200 Sales returns and allowances 800 100 Net sales $19,800 11,600 $ 8,200 $16,100 8,600 $ 7,500 Cost of merchandise (goods) sold Gross profit Operating expenses: Depreciation Selling and administrative Research Miscellaneous Total operating expenses Income before interest and taxes Interest expense 860 680 3,400 2,800 710 580 520 380 sa $5,490 $ 2,710 $ 4,440 $ 3,060 720 580 Income before taxes $ 1,990 $2,480 992 Provision for taxes 796 Net income $ 1,194 $ 1,488 LOGIC COMPANY Comparative Balance Sheet December 31, 2019 and 2020 2020 2019 Assets Current assets: Cash Accounts receivable Merchandise inventory Prepaid expenses Total current assets Plant and equipment: Building (net) $12,800 17,300 9,300 24,800 $64, 200 $ 48, 700 $ 9,800 13,300 14,800 10,800 $15,300 14,300 $11, 800 9,800 Land acer Σ %24 %24arrow_forwardni1arrow_forwardExcerpts from the annual report of XYZ Corporation follow: 2019 $675,138 $241,154 $64,150 $93,650 $25,100 2020 Cost of goods sold Inventory Net income $754,661 $219,686 $31,185 $68,685 $26,900 Retained earnings LIFO reserve Tax rate 20% 20% If XYZ used FIFO, its net income for fiscal 2020 would be O a. $34,165 O b. $30,375 O c. $32,625 d. $36,545arrow_forward
- Sales Allowances Fitz-Chivalry Corporation reports the following information on its 2019 income statement. $ millions Gross sales 2017 2018 2019 $27,694 $30,738 $36,714 Allowance for sales returns Net sales 1,940 2,156 2,185 $25,754 $28,582 $34,529 Required Analysis of financial statements from prior years shows that the company consistently estimates the allowance for sales returns at about 7% of gross sales. What adjustment, if any, would we make to the 2019 income statement? Assume the company's combined federal and state tax rate is 24%. Hint: For adjustments to the income statement, we assume the normal 7% for the ratio of Allowance for sales returns to Gross sales for each year. Determine the 2019 adjusted allowance for sales return. (Round answer to nearest whole number.) $ millions Adjusted (total) allowance for sales returns $ 2019 0 Using the adjusted (total) allowance for sales returns computed above, determine the 2019 adjustments for the following income statement items.…arrow_forwardSales revenue Cost of goods sold Gross profit Expenses Pretax income Income tax expense (30%) Net income 2016 $2,033,000 1,487,000 2017 $2,451,000 2018 $2,717,000 2019 $2,994,000 1,617,000 1,768,000 2,093,000 546,000 834,000 949,000 901,000 488,000 494,000 522,000 532,000 58,000 340,000 427,000 369,000 17,400 102,000 128,100 110,700 $40,600 $238,000 $298,900 $258,300 An audit revealed that in determining these amounts, the ending inventory for 2017 was overstated by $19,000. The company uses a periodic inventory system. 2. Compute the gross profit percentage for each year before the correction and after the correction. Note: Round your answers to the nearest whole percent. 2016 2017 2018 2019 Before correction % % % % After correction % % % %arrow_forwardpractice please help with formulaarrow_forward
- GIVE THE COMPARATIVE INCOME STATEMENT VERTICAL ANALYSIS FROM THE FOLLOWING INCOME STATEMENT BELOW JOLLIBEE INCOME STATEMENT ITEM 2016 2017 2018 2019 2020 Sales/Revenue 113.81B 133.61B 161.17B 179.63B 129.31B Sales Growth - 17.40% 20.62% 11.45% -28.01% Cost of Goods Sold (COGS) incl. D&A - - 132.96B 150.88B 115.39B COGS Growth - - - 13.47% -23.52% COGS excluding D&A 89.27B 105.39B 121.08B 137.38B 100.82B Depreciation & Amortization Expense 4B 4.75B 11.89B 13.5B 14.57B Depreciation 3.93B 4.66B 11.73B 13.34B 14.32B Amortization of Intangibles 68.99M 78.95M 151.82M 145.42M 245.23M Gross Income 20.54B 23.48B 28.21B 28.75B 13.92B Gross Income Growth - 14.30% 20.12% 1.93% -51.57% Gross Profit Margin - - - - 10.77% SG&A Expense - - 17.64B 20.21B 20.42B SGA Growth - - - 14.57% 1.02%…arrow_forwardOperating data for Blue Spruce Corp. are presented below. Sales revenue Cost of goods sold Selling expenses Administrative expenses Income tax expense Net income 2022 $822,500 528,300 124,000 74,700 38,700 56,800 2021 $643,500 414,600 79,000 53,000 27,900 69,000 Prepare a schedule showing a vertical analysis for 2022 and 2021. (Round percentages to 1 decimal place, e.g. 12.1%.)arrow_forwardSales Cost of goods sold Gross profit Operating expenses Income from operations Interest expense Income before income tax Income tax expense Net income (a) 2021 $1,595 900 695 524 171 80 Your answer is incorrect. 91 25 $66 2020 $1,387 $1,208 743 644 411 233 50 183 2019 46 596 612 402 210 40 170 43 $137 $127 Using horizontal analysis, calculate the horizontal percentage of a base-year amount, assuming 2019 is the base year. (Round answers to 1 decimal place, e.g. 5.2%. Enter negative amounts using either a negative sign preceding the number e.g. -45.1% or parentheses e.g. (45.1) %.)arrow_forward
- SUNLAND COMPANYIncome StatementsFor the Years Ended December 31 2022 2021 Net sales $2,178,400 $2,030,000 Cost of goods sold 1,207,000 1,187,080 Gross profit 971,400 842,920 Selling and administrative expenses 590,000 565,220 Income from operations 381,400 277,700 Other expenses and losses Interest expense 25,960 23,600 Income before income taxes 355,440 254,100 Income tax expense 106,632 76,230 Net income $ 248,808 $ 177,870 SUNLAND COMPANYBalance SheetsDecember 31 Assets 2022 2021 Current assets Cash $ 70,918 $ 75,756 Debt investments (short-term) 87,320 59,000 Accounts receivable 139,004 121,304 Inventory 148,680 136,290 Total current assets 445,922 392,350 Plant assets (net) 765,820 613,954 Total assets $1,211,742…arrow_forward(Current Purchasing Power Accounting, A Normative Accounting Theory) Financial statements in historical cost of Steven Ltd are shown as follows: Statement of financial performance for year ended 31 December 2022 Sales 1,650,000 Less Cost of goods sold 1,285,000 Gross profit 365,000 Less Operating expenses 156,000 201,600 45,600 163,400 Statement of financial position at the end of financial year 31-Dec 31-Dec 2021 2022 150,000 175,000 165,000 870,000 1,360,000 170,000 450,000 740,000 1,360,000 Depreciation Net profit Assets Current assets Cash Accounts receivable Inventory Non-current assets Equipment (net depreciation) Total assets Liabilities Current liabilities Accounts payable Shareholders' equity Share capital Retained profit Total liabilities and equity of + 317,000 350,000 210,000 824,400 + 1,701,400 348,000 450,000 903,400 1,701,400 Karrow_forwardSales Revenue Less: Cost of Goods Sold Gross Profits Less: Operating Expenses Operating Profits Less: Interest Expense Net Profits Before Taxes Less: Taxes (40%) Net Profits After Taxes Assets Cash Income Statement Pulp, Paper and Paperboard, Inc. For the Year Ended December 31, 2019 Accounts receivable Inventories Total current assets Gross fixed assets Less: Accumulated depreciation Net fixed assets Total assets Liabilities and stockholders' equity Current liabilities Balance Sheet Pulp, Paper and Paperboard, Inc. December 31, 2019 Accounts payable Notes payable Accruals Total current liabilities Long-term debts Total liabilities Stockholders' equity Common stock Retained earnings Total stockholders' equity Total liabilities and stockholders' equity Calculate the following: NP, GP $2,080,976 1,701,000 $ 379,976 273,846 $ 106,130 19,296 S 86,834 34,810 S 52,024 Current Ratio - Quick Ratio Receivable days - Payable days $ 95,000 237,000 243.000 $ 575,000 500,000 75.000 $ 425,000…arrow_forward
arrow_back_ios
SEE MORE QUESTIONS
arrow_forward_ios
Recommended textbooks for you

 AccountingAccountingISBN:9781337272094Author:WARREN, Carl S., Reeve, James M., Duchac, Jonathan E.Publisher:Cengage Learning,
 Accounting Information SystemsAccountingISBN:9781337619202Author:Hall, James A.Publisher:Cengage Learning,
 Horngren's Cost Accounting: A Managerial Emphasis...AccountingISBN:9780134475585Author:Srikant M. Datar, Madhav V. RajanPublisher:PEARSON
 Intermediate AccountingAccountingISBN:9781259722660Author:J. David Spiceland, Mark W. Nelson, Wayne M ThomasPublisher:McGraw-Hill Education
 Financial and Managerial AccountingAccountingISBN:9781259726705Author:John J Wild, Ken W. Shaw, Barbara Chiappetta Fundamental Accounting PrinciplesPublisher:McGraw-Hill Education


Accounting
Accounting
ISBN:9781337272094
Author:WARREN, Carl S., Reeve, James M., Duchac, Jonathan E.
Publisher:Cengage Learning,

Accounting Information Systems
Accounting
ISBN:9781337619202
Author:Hall, James A.
Publisher:Cengage Learning,

Horngren's Cost Accounting: A Managerial Emphasis...
Accounting
ISBN:9780134475585
Author:Srikant M. Datar, Madhav V. Rajan
Publisher:PEARSON

Intermediate Accounting
Accounting
ISBN:9781259722660
Author:J. David Spiceland, Mark W. Nelson, Wayne M Thomas
Publisher:McGraw-Hill Education

Financial and Managerial Accounting
Accounting
ISBN:9781259726705
Author:John J Wild, Ken W. Shaw, Barbara Chiappetta Fundamental Accounting Principles
Publisher:McGraw-Hill Education