Intermediate Accounting: Reporting And Analysis
3rd Edition
ISBN: 9781337788281
Author: James M. Wahlen, Jefferson P. Jones, Donald Pagach
Publisher: Cengage Learning
expand_more
expand_more
format_list_bulleted
Question
According with attached images:
You are requested to:
Prepare Cash Flow Statement for year 2018 of company PUELCHE, according to both Direct and Indirect Method (show in detail each calculation with formulas).
THANKS :D

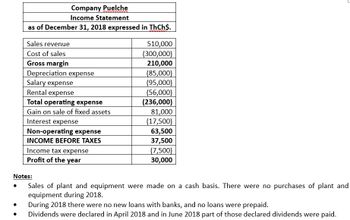
Transcribed Image Text:Company Puelche
Income Statement
as of December 31, 2018 expressed in ThCh$.
Sales revenue
510,000
Cost of sales
(300,000)
Gross margin
210,000
Depreciation expense
(85,000)
Salary expense
(95,000)
Rental expense
(56,000)
Total operating expense
(236,000)
Gain on sale of fixed assets
81,000
Interest expense
(17,500)
Non-operating expense
63,500
INCOME BEFORE TAXES
37,500
Income tax expense
(7,500)
Profit of the year
30,000
Notes:
Sales of plant and equipment were made on a cash basis. There were no purchases of plant and
equipment during 2018.
During 2018 there were no new loans with banks, and no loans were prepaid.
Dividends were declared in April 2018 and in June 2018 part of those declared dividends were paid.

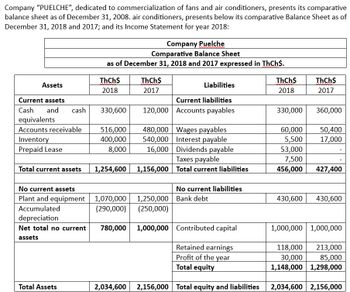
Transcribed Image Text:Company "PUELCHE", dedicated to commercialization of fans and air conditioners, presents its comparative
balance sheet as of December 31, 2008. air conditioners, presents below its comparative Balance Sheet as of
December 31, 2018 and 2017; and its Income Statement for year 2018:
Company Puelche
Comparative Balance Sheet
as of December 31, 2018 and 2017 expressed in ThCh$.
ThCh$
ThCh$
ThCh$
ThCh$
Assets
Liabilities
2018
2017
2018
2017
Current assets
Current liabilities
Cash and cash
330,600
120,000 Accounts payables
330,000
360,000
equivalents
Accounts receivable
516,000
480,000 Wages payables
60,000
50,400
Inventory
400,000
540,000
Interest payable
5,500
17,000
Prepaid Lease
8,000
16,000
Dividends payable
53,000
Taxes payable
7,500
Total current assets
1,254,600 1,156,000 Total current liabilities
456,000
427,400
No current assets
Plant and equipment
1,070,000
No current liabilities
1,250,000 Bank debt
430,600 430,600
Accumulated
(290,000)
(250,000)
depreciation
Net total no current
assets
780,000 1,000,000 Contributed capital
1,000,000 1,000,000
Retained earnings
118,000 213,000
Profit of the year
Total equity
30,000
1,148,000
85,000
1,298,000
Total Assets
2,034,600
2,156,000 Total equity and liabilities
2,034,600 2,156,000
Expert Solution
This question has been solved!
Explore an expertly crafted, step-by-step solution for a thorough understanding of key concepts.
Step by stepSolved in 2 steps

Knowledge Booster
Similar questions
- Comparative balance sheets for 2021 and 2020 and a statement of income for 2021 are given below for Metagrobolize Industries. Additional information from the accounting records of Metagrobolize also is provided. METAGROBOLIZE INDUSTRIESComparative Balance SheetsDecember 31, 2021 and 2020($ in thousands) 2021 2020 Assets Cash $ 580 $ 375 Accounts receivable 600 450 Inventory 900 525 Land 675 600 Building 900 900 Less: Accumulated depreciation (300 ) (270 ) Equipment 2,850 2,250 Less: Accumulated depreciation (525 ) (480 ) Patent 1,200 1,500 $ 6,880 $ 5,850 Liabilities Accounts payable $ 750 $ 450 Accrued liabilities 300 225 Lease liability—land 130 0 Shareholders' Equity Common stock 3,150 3,000 Paid-in capital—excess of par 750 675…arrow_forwardDisaggregate Traditional DuPont ROE Graphical representations of the KLA-Tencor 2018 income statement and average balance sheet numbers (2017-2018) follow ($ thousands). KLA-Tencor Average Balance Sheet 2017-2018 $1,473,464 O $2,583,930 -$2,627,235.5 $1,518,3711 Operating assets Nonoperating assets Operating labilities Nonoperating Babies Equity + 0 수 $2.948.529 0 KLA-Tencor Income Statement 2018 $802,265 $653.666- ✪ 0 O $81,263 a. Compute return on equity (ROE). Note: 1. Select the appropriate numerator and denominator used to compute ROE from the drop-down menu options. 2. Enter the numerator and denominator amounts to compute ROE. Numerator Denominator ROE Operating expenses Tax expense 수 0 b. Apply the DuPont disaggregation into return on assets (ROA) and financial leverage (FL). Note: 1. Select the appropriate numerator and denominator used to compute ROA from the drop-down menu options. 2. Enter the numerator and denominator amounts to compute ROA. Numerator Denominator ROA 수 0…arrow_forwardSuppose the following financial data were reported by 3M Company for 2019 and 2020 (dollars in millions). 3M CompanyBalance Sheets (partial) 2020 2019Current assets Cash and cash equivalents $3,180 $1,836Accounts receivable, net 3,600 3,180Inventories 2,738 3,019Other current assets 1,932 1,590Total current assets $11,450 $9,625Current liabilities $4,830 $5,887 Calculate the current ratio and working capital for 3M for 2019 and 2020. (Round current ratio to 2 decimal places, e.g. 1.25 : 1. Enter working capital answers to million.) Current ratio 2019 :12020 :1 Working capital 2019 $ million2020 $ million Link to Textarrow_forward
- A comparative balance sheet for Gena Company appears below:GENA COMPANYComparative Balance SheetDec. 31, 2021 Dec. 31, 2020AssetsCash $ 34,000 $11,000Accounts receivable 21,000 13,000Inventory 35,000 17,000Prepaid expenses 6,000 9,000Long-term investments -0- 17,000Equipment 60,000 33,000Accumulated depreciation—equipment (20,000) (15,000)Total assets $136,000 $85,000Liabilities and Stockholders' EquityAccounts payable $ 17,000 $ 7,000Bonds payable 36,000 45,000Common stock 53,000 23,000Retained earnings 30,000 10,000Total liabilities and stockholders' equity $136,000 $85,000Additional information:1. Net income for the year ending December 31, 2021 was $35,000.2. Cash dividends of $15,000 were declared and paid during the year.3. Long-term investments that had a cost of $17,000 were sold for $14,000.4. Depreciation expense for the year was $5,000.InstructionsPrepare a full statement of cash flows for the year ended December 31, 2021, using the indirectmethod.arrow_forwardRequired information [The following information applies to the questions displayed below.] Selected comparative financial statements of Korbin Company follow. KORBIN COMPANY Comparative Income Statements For Years Ended December 31 2021 2020 $ $ 467,052 357,800 281,165 223,625 185,887 134, 175 66,321 49,376 42,035 31,486 108,356 80,862 77,531 53,313 14,421 10,929 $ $ 63,110 42,384 Sales Cost of goods sold Gross profit Selling expenses Administrative expenses Total expenses Income before taxes Income tax expense Net income KORBIN COMPANY Comparative Balance Sheets 2020 Assets Current assets Long-term investments Plant assets, net Total assets December 31 2021 Liabilities and Equity Current liabilities Common stock Other paid-in capital Retained earnings Total liabilities and equity Assets Current assets Long-term investments Plant assets, net Total assets Liabilities and Equity Current liabilities Common stock Other paid-in capital Retained earnings Total liabilities and equity 2019 $…arrow_forwardSuppose the following financial data were reported by 3M Company for 2019 and 2020 (dollars in millions). 3M CompanyBalance Sheets (partial) 2020 2019Current assets Cash and cash equivalents $3,200 $1,845Accounts receivable, net 3,450 3,180Inventories 2,639 3,042Other current assets 1,872 1,549Total current assets $11,161 $9,616Current liabilities $4,853 $5,893 (a)Calculate the current ratio and working capital for 3M for 2019 and 2020. (Round current ratio to 2 decimal places, e.g. 1.25 : 1. Enter working capital answers to million.) Current ratio 2019 :12020 :1 Working capital 2019 $ million2020 $ million (b)The parts of this question must be completed in order. This part will be available when you complete the part above.arrow_forward
- please answerarrow_forwardReturn on total assets ratio: net income/ average total assets 21,331/(321,195+225,248)/2= 0.07807= 7.8% (2020 year) 11588/(162,648+225,248)/2= 0.059= 6.0% (2019 year) Write financial analysis report.arrow_forwardComparative balance sheet accounts of Flounder Inc. are presented below. FLOUNDER INC.COMPARATIVE BALANCE SHEET ACCOUNTSAS OF DECEMBER 31, 2020 AND 2019December 31Debit Accounts 2020 2019Cash $42,300 $34,000Accounts Receivable 70,600 59,600Inventory 30,000 23,900Equity investments 22,500 38,700Machinery 29,700 18,600Buildings 67,900 56,600Land 7,500 7,500 $270,500 $238,900Credit Accounts Allowance for Doubtful Accounts $2,200 $1,500Accumulated Depreciation—Machinery 5,700 2,300Accumulated Depreciation—Buildings 13,600 8,900Accounts Payable 34,800 24,500Accrued Payables 3,300 2,700Long-Term Notes Payable 21,200 31,200Common Stock, no-par 150,000 125,000Retained Earnings 39,700 42,800 $270,500 $238,900 Additional data (ignoring taxes): 1. Net income for the year was $43,100.2. Cash dividends declared and paid during the year were $21,200.3. A 20% stock dividend was declared during the…arrow_forward
- Please fill out vertical analysis of this balance sheet to determine component percentage of assets liabilities and stockholders equity based on data. Round percentages to the nearest hundredths percentarrow_forwardCompute DuPont Analysis Ratios Selected balance sheet and income statement information for Humana Inc., a health and well-being company, follows. 2018 2017 Company ($ millions) Ticker Revenue income Assets Assets Humana Inc HUM $66,832 $11,603 $35,333 $37,098 2018 Compute the following 2018 ratios for Humana. a. Return on equity (ROE) $ $ Note: 1. Select the appropriate numerator and denominator used to compute ROE from the drop-down menu options. 2. Enter the numerator and denominator amounts to compute ROE. Numerator Denominator 0 $ $ 2018 Net 2018 2017 Stockholders' Stockholders' 0 $ ♦ 0 b. Profit margin (PM) Note: 1. Select the appropriate numerator and denominator used to compute PM from the drop-down menu options. 2. Enter the numerator and denominator amounts to compute PM. Numerator Denominator 0 $ ◆ Equity $20,081 0 ROE 0 PM c. Financial leverage (FL) Note: 1. Select the appropriate numerator and denominator used to compute FL from the drop-down menu options. 2. Enter the…arrow_forwardSelected comparative financial statements of Korbin Company follow. KORBIN COMPANY Comparative Income Statements For Years Ended December 31 2021 2020 $ 442,035 $ 338,635 266,105 214,695 123,940 46,732 29,800 76,532 47,408 9,719 Sales Cost of goods sold Gross profit! Selling expenses Administrative expenses Total expenses Income before taxes Income tax expense Net income Assets Current assets Long-term investments Plant assets, net Total assets Liabilities and Equity Current liabilities Common stock Other paid-in capital Retained earnings KORBIN COMPANY Comparative Balance Sheets Sales Cost of goods sold Gross profit Selling expenses Administrative expenses Total expenses Income before taxes Income tax expense Net income Assets Current assets KORBIN COMPANY Common-Size Comparative Income Statements For Years Ended December 31, 2021, 2020, and 2019 2021 2020 Long-term investments Plant assets, net Total assets 175,930 62,769 39,783 102,552 73,378 13,648 $ 59,730 $ 37,689 Liabilities and…arrow_forward
arrow_back_ios
SEE MORE QUESTIONS
arrow_forward_ios
Recommended textbooks for you
 Intermediate Accounting: Reporting And AnalysisAccountingISBN:9781337788281Author:James M. Wahlen, Jefferson P. Jones, Donald PagachPublisher:Cengage Learning

Intermediate Accounting: Reporting And Analysis
Accounting
ISBN:9781337788281
Author:James M. Wahlen, Jefferson P. Jones, Donald Pagach
Publisher:Cengage Learning