MATLAB: An Introduction with Applications
6th Edition
ISBN: 9781119256830
Author: Amos Gilat
Publisher: John Wiley & Sons Inc
expand_more
expand_more
format_list_bulleted
Question

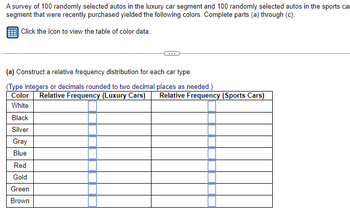
Transcribed Image Text:A survey of 100 randomly selected autos in the luxury car segment and 100 randomly selected autos in the sports car
segment that were recently purchased yielded the following colors. Complete parts (a) through (c).
Click the icon to view the table of color data.
(a) Construct a relative frequency distribution for each car type.
(Type integers or decimals rounded to two decimal places as needed.)
Relative Frequency (Luxury Cars)
Relative Frequency (Sports Cars)
Color
White
Black
Silver
Gray
Blue
Red
Gold
Green
Brown

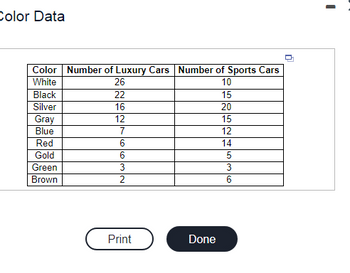
Transcribed Image Text:Color Data
Color Number of Luxury Cars Number of Sports Cars
White
26
10
Black
22
15
Silver
16
20
Gray
12
15
Blue
7
12
Red
6
14
Gold
6
5
Green
3
3
Brown
2
6
Print
Done
Expert Solution
This question has been solved!
Explore an expertly crafted, step-by-step solution for a thorough understanding of key concepts.
Step by stepSolved in 2 steps with 3 images

Knowledge Booster
Similar questions
- When 30 randomly selected customers left a convenience store, each was asked the number of items he or she purchased. Construct an ungrouped frequency distribution for the data. Create a histogram for the data in #7. Create a frequency polygon for the data in #7. 2 10 5 4 7 6 3 9 7 6 7 6 4 9 7 6 3 4 3 5 6 10 10 9 10 4 3 2 8 5arrow_forwardCreate a stem and leaf diagram and a frequency histogram for the following situations. 1. The following data list represents the heights of 30 randomly selected adults. 58 63 59 62 64 75 64 2875 73 63 92889 56 64 68 70 67 72 8589 68 67 60 2762 72 71 63 328 63 64 62 7222 67 62 71 68 7780 70 72arrow_forwardRichard’s doctor had told him he needed to keep track of his blood sugar readings. Listed below are his 20 latest readings. He wanted to create a visual aid for himself in order to see how his blood sugar was doing. 75 125 110 82 178 209 150 130 120 142 90 98 107 163 135 129 147 152 110 100 A. Create a frequency distribution table for the given data set. B. Create a histogram for the data set. C. Describe the distribution of the data.arrow_forward
- The frequency distribution to the right shows the various levels of demand for a particular laptop computer sold by a store during the last 50 business days. Determine the average number of laptops sold per day. Number of Laptops Frquency 0 251 52 63 114 15 2arrow_forwardThe following data describes percentage of satisfied customers at Touchdown Sporting Goods. Complete the frequency table for this data. 86.9, 80.8, 91.1, 77.4, 85.6, 84.3, 86.6, 77.8, 88.6, 87.2, 87.3, 93.1, 95.8, 90.8, 84.9, 79.1, 86.1, 80.3 Determine the frequency of each class in the table shown. Answer Percentage of Satisfied Customers at Touchdown Sporting Goods Class 77.0-80.9 81.0-84.9 85.0-88.9 89.0-92.9 93.0-96.9 Frequency Earrow_forwardThe following data show the ages of recent award-winning male actors at the time when they won their award. Make a frequency table for the data, using bins of 20-29, 30-39, and so on. Click the icon to view the ages of male actors. Complete the table below. Age 20-29 30-39 40-49 50-59 60-69 70-79 No. of actors ☐☐☐☐☐☐ Data table 20 54 34 41 50 59 48 34 31 65 44 28 79 49 48 34 59 59 34 44 48 31 43 35 63 58 35 49 41 77 43 C 57 30 38 D - Xarrow_forward
- The following data show the ages of recent award-winning male actors at the time when they won their award. Make a frequency table for the data, using bins of 20-29, 30-39, and so on. Click the icon to view the ages of male actors. Complete the table below. Age No. of actors Data Table 20-29 30-39 40-49 36 53 23 67 53 56 48 39 49 52 50-59 37 49 50 46 31 42 65 57 73 33 60-69 53 41 31 49 41 35 39 46 48 34 70-79 35 63 42 37 Print Donearrow_forwardThe price drivers pay for gasoline often varies a great deal across regions throughout the United States. The following data show the price per gallon for regular gasoline for a random sample of gasoline service stations for three major brands of gasoline (Shell, BP, and Marathon) located in eleven metropolitan areas across the upper Midwest region (OhioGasPrices.com website, March 18, 2012). Click on the datafile logo to reference the data. DATA file Shell BP Metropolitan Area Marathon Akron, Ohio Cincinnati, Ohio Cleveland, Ohio Columbus, Ohio Ft. Wayne, Indiana Indianapolis, Indiana Lansing, Michigan Lexington, Kentucky Louisville, Kentucky Muncie, Indiana Toledo, Ohio 3.77 3.72 3.87 3.76 3.78 3.87 3.89 3.79 3.83 3.83 3.85 3.77 3.83 3.85 3.93 3.84 3.84 4.04 3.87 3.87 3.99 3.79 3.78 3.81 3.69 3.78 3.84 3.84 3.83 3.79 3.79 3.86 3.86 Use a = .05 to test for any significant difference in the mean price of gasoline for the three brands. Round SS to 6 decimals, MS to 6 decimals, F to 2…arrow_forwardThe following frequency table summarizes a set of data. What is the five-number summary? Value Frequency 2 3 3 2 5 1 6 3 7 1 8 2 11 3arrow_forward
- Below is the frequency distribution of personal Computers on by students at a community college. Find the percent represented by sony computers brand Frequency dell 3,200 sony 5,200 hp 4,400 toshiba 6,600 asus. 3,600arrow_forwardUse the frequency histogram to complete the following parts. (a) Determine the number of classes. (b) Estimate the greatest and least frequencies. (c) Determine the class width. (d) Describe any patterns with the data. (a) There are (Type a whole number.) classes. (b) The least frequency is about (Round to the nearest whole number as needed.) The greatest frequency is about. (Round to the nearest whole number as needed.) (c) The class width is $0. (Type an integer or a decimal. Do not round.) (d) What pattern does the histogram show? A. About half of the employees' salaries are between $40,000 and $49,000. B. About half of the employees' salaries are between $50,000 and $59,000. C. Most employees make less than $34,000 or more than $60,000. D. Less than half of the employees make between $35,000 and $59,000. Frequency 300- 200- 100- 0- Employee Salaries 32 37 42 47 52 57 62 Salary (in thousands of dollars) Oarrow_forward
arrow_back_ios
arrow_forward_ios
Recommended textbooks for you
 MATLAB: An Introduction with ApplicationsStatisticsISBN:9781119256830Author:Amos GilatPublisher:John Wiley & Sons Inc
 Probability and Statistics for Engineering and th...StatisticsISBN:9781305251809Author:Jay L. DevorePublisher:Cengage Learning
 Statistics for The Behavioral Sciences (MindTap C...StatisticsISBN:9781305504912Author:Frederick J Gravetter, Larry B. WallnauPublisher:Cengage Learning
 Elementary Statistics: Picturing the World (7th E...StatisticsISBN:9780134683416Author:Ron Larson, Betsy FarberPublisher:PEARSON
 The Basic Practice of StatisticsStatisticsISBN:9781319042578Author:David S. Moore, William I. Notz, Michael A. FlignerPublisher:W. H. Freeman
 Introduction to the Practice of StatisticsStatisticsISBN:9781319013387Author:David S. Moore, George P. McCabe, Bruce A. CraigPublisher:W. H. Freeman

MATLAB: An Introduction with Applications
Statistics
ISBN:9781119256830
Author:Amos Gilat
Publisher:John Wiley & Sons Inc

Probability and Statistics for Engineering and th...
Statistics
ISBN:9781305251809
Author:Jay L. Devore
Publisher:Cengage Learning

Statistics for The Behavioral Sciences (MindTap C...
Statistics
ISBN:9781305504912
Author:Frederick J Gravetter, Larry B. Wallnau
Publisher:Cengage Learning

Elementary Statistics: Picturing the World (7th E...
Statistics
ISBN:9780134683416
Author:Ron Larson, Betsy Farber
Publisher:PEARSON

The Basic Practice of Statistics
Statistics
ISBN:9781319042578
Author:David S. Moore, William I. Notz, Michael A. Fligner
Publisher:W. H. Freeman

Introduction to the Practice of Statistics
Statistics
ISBN:9781319013387
Author:David S. Moore, George P. McCabe, Bruce A. Craig
Publisher:W. H. Freeman