
ENGR.ECONOMIC ANALYSIS
14th Edition
ISBN: 9780190931919
Author: NEWNAN
Publisher: Oxford University Press
expand_more
expand_more
format_list_bulleted
Related questions
Question
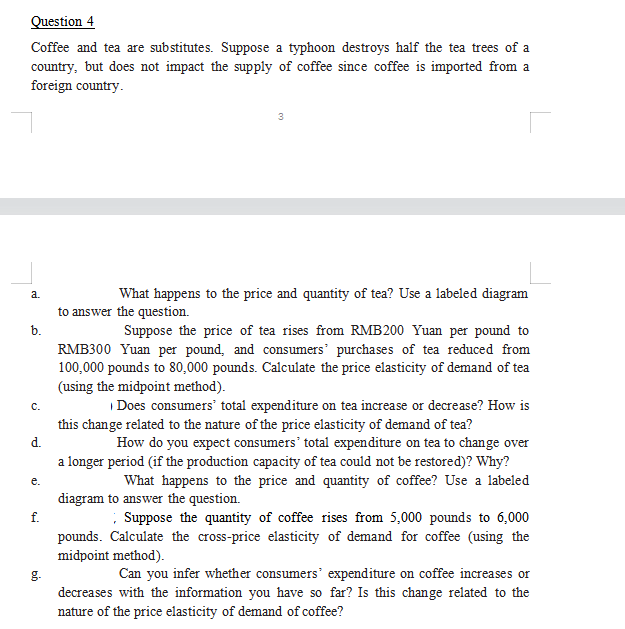

Transcribed Image Text:Question 4
Coffee and tea are substitutes. Suppose a typhoon destroys half the tea trees of a
country, but does not impact the supply of coffee since coffee is imported from a
foreign country.
a.
What happens to the price and quantity of tea? Use a labeled diagram
to answer the question.
b.
C.
d.
e.
3
f.
Suppose the price of tea rises from RMB 200 Yuan per pound to
RMB300 Yuan per pound, and consumers' purchases of tea reduced from
100,000 pounds to 80,000 pounds. Calculate the price elasticity of demand of tea
(using the midpoint method).
Does consumers' total expenditure on tea increase or decrease? How is
this change related to the nature of the price elasticity of demand of tea?
How do you expect consumers' total expenditure on tea to change over
a longer period (if the production capacity of tea could not be restored)? Why?
What happens to the price and quantity of coffee? Use a labeled
diagram to answer the question.
Suppose the quantity of coffee rises from 5,000 pounds to 6,000
pounds. Calculate the cross-price elasticity of demand for coffee (using the
midpoint method).
Can you infer whether consumers' expenditure on coffee increases or
decreases with the information you have so far? Is this change related to the
nature of the price elasticity of demand of coffee?
Expert Solution
This question has been solved!
Explore an expertly crafted, step-by-step solution for a thorough understanding of key concepts.

This is a popular solution

Trending nowThis is a popular solution!

Step by stepSolved in 5 steps with 2 images

Knowledge Booster


Learn more about
Need a deep-dive on the concept behind this application? Look no further. Learn more about this topic, economics and related others by exploring similar questions and additional content below.Similar questions
- Suppose a decrease in the world demand for desktop computers causes the price of desktop computers to fall from $600 to $500. Before the fall in demand, Juna, a local computer dealer in Japan, used to produce 9,000 desktop computers and exported 50 percent of it to other countries every week. However, after the fall in demand, Juna reduced its production to 8,000 units and exports only 40 percent of its total output.a. What are the changes in the quantity sold to domestic consumersb. What are the changes in the consumer surplus?c. Sketch a diagram to illustrate the changes for Juna.arrow_forwardConsider the market for wine in the diagram below: 70 Price ($) 60 50 40 30 20 10 S D 100 200 300 400 500 600 700 800 Wine (millions of bottles) $45 and 550 million bottles of wine $45 and 500 million bottles of wine $50 and 600 million bottles of wine $50 and 500 million bottles of wine Suppose supply shifts to the right by 100 million bottles of wine. What would be the new equilibrium price and quantity of wine as a result of this increase in supply?arrow_forwardIn this question, you'll explore the effect of a plentiful crop in Vermont on the price of blueberries in the United States, as well as on the daily wages of blueberry pickers in Florida. Assume that blueberry buyers don't care whether their blueberries come from Vermont or Florida. On the following graph, show the effect the plentiful crop in Vermont has on the market for blueberries in the United States by shifting either the demand curve, the supply curve, or both. PRICE (Dollars per pint) 10 fall 9 WAGE (Dollars per worker) 8 7 2 + 1 0 + 0 Market for Blueberries in the United States Supply Demand 50 100 150 200 250 300 350 400 450 500 QUANTITY (Millions of pints of blueberries) Based on the graph for the market for blueberries in the United States, the plentiful crop has caused the price of blueberries in the United States to wing graph shows the daily market for blueberry pickers in Florida. Market for Blueberry Pickers in Florida Demand rise Show the effect of the change in the…arrow_forward
- Consider the market for pens. Suppose that new medical concerns regarding graphite absorption have put pressure on schools to reduce pencil use in favor of pens. Further, the price of plastic, a major input in the pen production process, has dropped sharply. On the following graph, labeled Scenario 1, indicate the effect these two events have on the demand for and supply of pens. Note: Select and drag one or both of the curves to the desired position. Curves will snap into position, so if you try to move a curve and it snaps back to its original position, just drag it a little farther. PRICE (Dollars per pen) 10 Supply 8 7 X Demand 5 6 7 8 9 10 2 3 QUANTITY (Millions of pens) 9 1 0 10 Scenario 1 0 1 Scenario 2 9 Supply 8 7 X Demand 2 0 1 2 3 4 5 6 7 8 9 10 QUANTITY (Millions of pens) 1 0 Next, complete the following graph, labeled Scenario 2, by shifting the supply and demand curves in the same way that you did on the Scenario 1 graph. Demand 0 Supply Demand Supply ?arrow_forwardSuppose the price of apples (a complement to peanut butter) rises. At the same time, suppose the price of peanuts (which are used to make peanut butter) falls. Given these changes, you should expect to see: a decrease in the equilibrium price of peanut butter, but it's hard to say what will happen to the equilibrium quantity. an increase in both the equilibrium price and quantity of peanut butter. an increase in the equilibrium quantity of peanut butter, but it's hard to say what will happen to the equilibrium price. an increase in the equilibrium price of peanut butter, but it's hard to say what will happen to the equilibrium quantity.arrow_forwardWhat are the effects on the equilibrium price and quantity of chocolate if information becomes available that eating chocolate makes your hair fall out and at the same time the price of sugar that is needed to make chocolate reduces by 10 percent? Clearly state the effect on demand and supply and whether equilibrium price and/or quantity have increased, decreased or whether the outcome is uncertain.arrow_forward
- The following table shows the annual demand and supply in the market for orange juice in San Diego. Price (Dollars per gallon of orange juice) 2 12 4 6 8 10 9 (axınl abuex Quantity Demanded (Gallons of orange juice) 500 400 300 200 100 On the following graph, plot the demand for orange juice using the blue point (circle symbol). Next, plot the supply of orange juice using the orange point (square symbol). Finally, use the black point (plus symbol) to indicate the equilibrium price and quantity in the market for orange juice. Note: Plot your points in the order in which you would like them connected. Line segments will connect the points automatically. Quantity Supplied (Gallons of orange juice) 50 150 200 300 450 Demand --arrow_forwardSuppose that more people have opened their own e-business because they wanted to be their own bosses, but the demand for e-products has grown even faster as the economy recovered from the pandemic. How would this affect the equilibrium price and quantity of meals sold by restaurants? (reperesnt this in graph)arrow_forwardThe demand curve intersects with the quantity sold axis at _____ electric automobiles. (Remember to use a comma, if a comma is needed and to include the decimal point and two numbers to the right of the decimal point).arrow_forward
- Suppose that Carlos and Deborah are the only suppliers of pieces of cake in some hypothetical market. Their annual supply schedules are given by the following table: Carlos's Quantity Supplied Deborah's Quantity Supplied (Pieces) ITT 20 30 35 40 PRICE (Dollars per piece) (Dollars per piece) 5 Price 0 0 1 2 3 4 5 20 On the following graph, plot Carlos's supply of pieces of cake using the green points (triangle symbol). Next, plot Deborah's supply of pieces of cake using the purple points (diamond symbol). Finally, plot the market supply of pieces of cake using the orange points (square symbol). Note: Line segments will automatically connect the points. Remember to plot from left to right. (?) 40 60 80 QUANTITY (Pieces) 100 (Pieces) 120 20 40 55 65 70 Carlos's Supply Deborah's Supply O Market Supplyarrow_forwardPlease help me answer all parts. Thank you.arrow_forward
arrow_back_ios
arrow_forward_ios
Recommended textbooks for you
 Principles of Economics (12th Edition)EconomicsISBN:9780134078779Author:Karl E. Case, Ray C. Fair, Sharon E. OsterPublisher:PEARSON
 Engineering Economy (17th Edition)EconomicsISBN:9780134870069Author:William G. Sullivan, Elin M. Wicks, C. Patrick KoellingPublisher:PEARSON
 Principles of Economics (MindTap Course List)EconomicsISBN:9781305585126Author:N. Gregory MankiwPublisher:Cengage Learning
 Managerial Economics: A Problem Solving ApproachEconomicsISBN:9781337106665Author:Luke M. Froeb, Brian T. McCann, Michael R. Ward, Mike ShorPublisher:Cengage Learning
 Managerial Economics & Business Strategy (Mcgraw-...EconomicsISBN:9781259290619Author:Michael Baye, Jeff PrincePublisher:McGraw-Hill Education
Principles of Economics (12th Edition)
Economics
ISBN:9780134078779
Author:Karl E. Case, Ray C. Fair, Sharon E. Oster
Publisher:PEARSON
Engineering Economy (17th Edition)
Economics
ISBN:9780134870069
Author:William G. Sullivan, Elin M. Wicks, C. Patrick Koelling
Publisher:PEARSON
Principles of Economics (MindTap Course List)
Economics
ISBN:9781305585126
Author:N. Gregory Mankiw
Publisher:Cengage Learning
Managerial Economics: A Problem Solving Approach
Economics
ISBN:9781337106665
Author:Luke M. Froeb, Brian T. McCann, Michael R. Ward, Mike Shor
Publisher:Cengage Learning
Managerial Economics & Business Strategy (Mcgraw-...
Economics
ISBN:9781259290619
Author:Michael Baye, Jeff Prince
Publisher:McGraw-Hill Education